Homepage Design Examples (574)
The homepage is the most important page on the site. It takes the traffic in and sends it on to every other page. Browse 574 real ones, captured live, and see what the market actually does.
Showing 1–24 of 574 homepages
What the strongest homepages do differently
Sorting these 574 homepages by how they score against the conversion rubric, then comparing the strongest 114 with the weakest 114, is the fastest way to see what actually separates them.
Proof
- +5534%89%
- +4846%94%
- +3914%53%
- +3418%52%
- +2853%81%
- +2424%48%
- +2425%49%
- +1724%41%
Pricing
- +3246%78%
Explaining the product
- +2921%50%
- +1916%35%
- +1736%53%
- -1548%33%
Layout
- +2342%65%
- +1517%32%
Other
- +1582%97%
How to structure a homepage, by the numbers
The questions a team asks when it rebuilds a homepage, answered from the 574 here. Where the strongest 114 and the weakest 114 disagree, that gap is the answer.
How many calls to action?
- One ask, repeated 3 times down the page
- 74% close on a CTA band
- 88% add a second button, usually a sales door next to the self-serve one
- 31% write a line under the button, almost always "no credit card required"
How is the hero structured?
What the hero shows
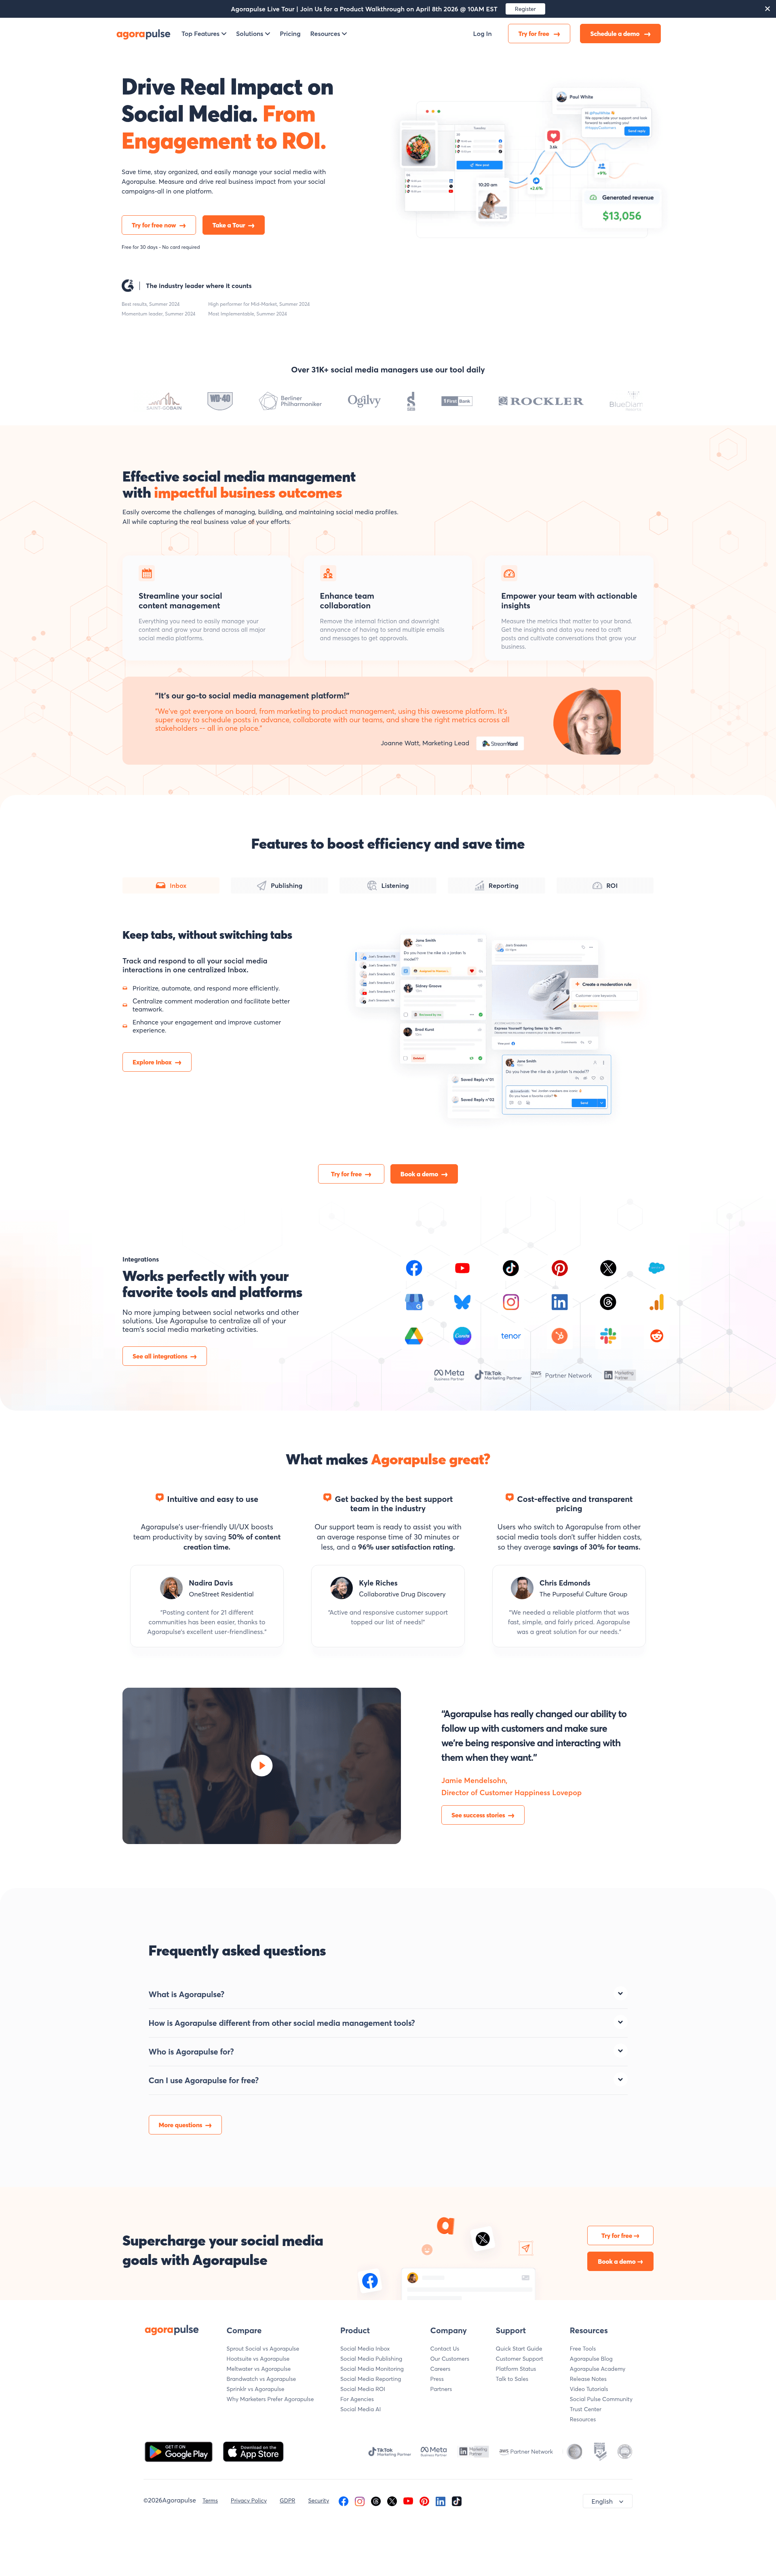
- Product UI333 homepages
- Illustration80 homepages
- Photography63 homepages
- No media at all47 homepages
- Video26 homepages

What comes right after the hero?
The section right after the hero
- Logo wall or trust bar404 homepages
- Features75 homepages
- Value proposition34 homepages
- Problem18 homepages
- Testimonials10 homepages
- Use cases9 homepages
- Comparison6 homepages
- How it works5 homepages
Proof first, then the product. The logo wall is on 81% of the strongest and 53% of the weakest.
How many sections?
8 between the navigation and the footer, half of them between 7 and 10.
The most common first three sections
- HeroLogo wall or trust barFeatures34% · 196 homepages
- HeroLogo wall or trust barProblem9% · 54 homepages
- HeroLogo wall or trust barValue proposition9% · 54 homepages
- HeroLogo wall or trust barHow it works5% · 28 homepages
- HeroFeaturesLogo wall or trust bar4% · 25 homepages
The last section before the footer
- Closing CTA band423 homepages
- FAQ46 homepages
- Resources29 homepages
- Logo wall or trust bar16 homepages
Which sections?
Share of homepages carrying each section
- Features537 homepages
- Closing CTA band514 homepages
- Logo wall or trust bar501 homepages
- Testimonials442 homepages
- How it works266 homepages
- Integrations225 homepages
- Use cases224 homepages
- Value proposition179 homepages
- Resources176 homepages
- FAQ170 homepages
- Problem107 homepages
- Comparison77 homepages
- Pricing60 homepages
- About33 homepages
Three of them split the strongest and the weakest:
- How it works: 53% against 36%
- FAQ: 35% against 16%
- Integrations: 50% against 21%

Should the homepage show prices?
- 13% show a price on the homepage
- 62% put a pricing link in the navigation
The moves almost nobody makes
Each sits under 15% of the market, with the strongest homepage that uses it.
A comparison against named alternatives
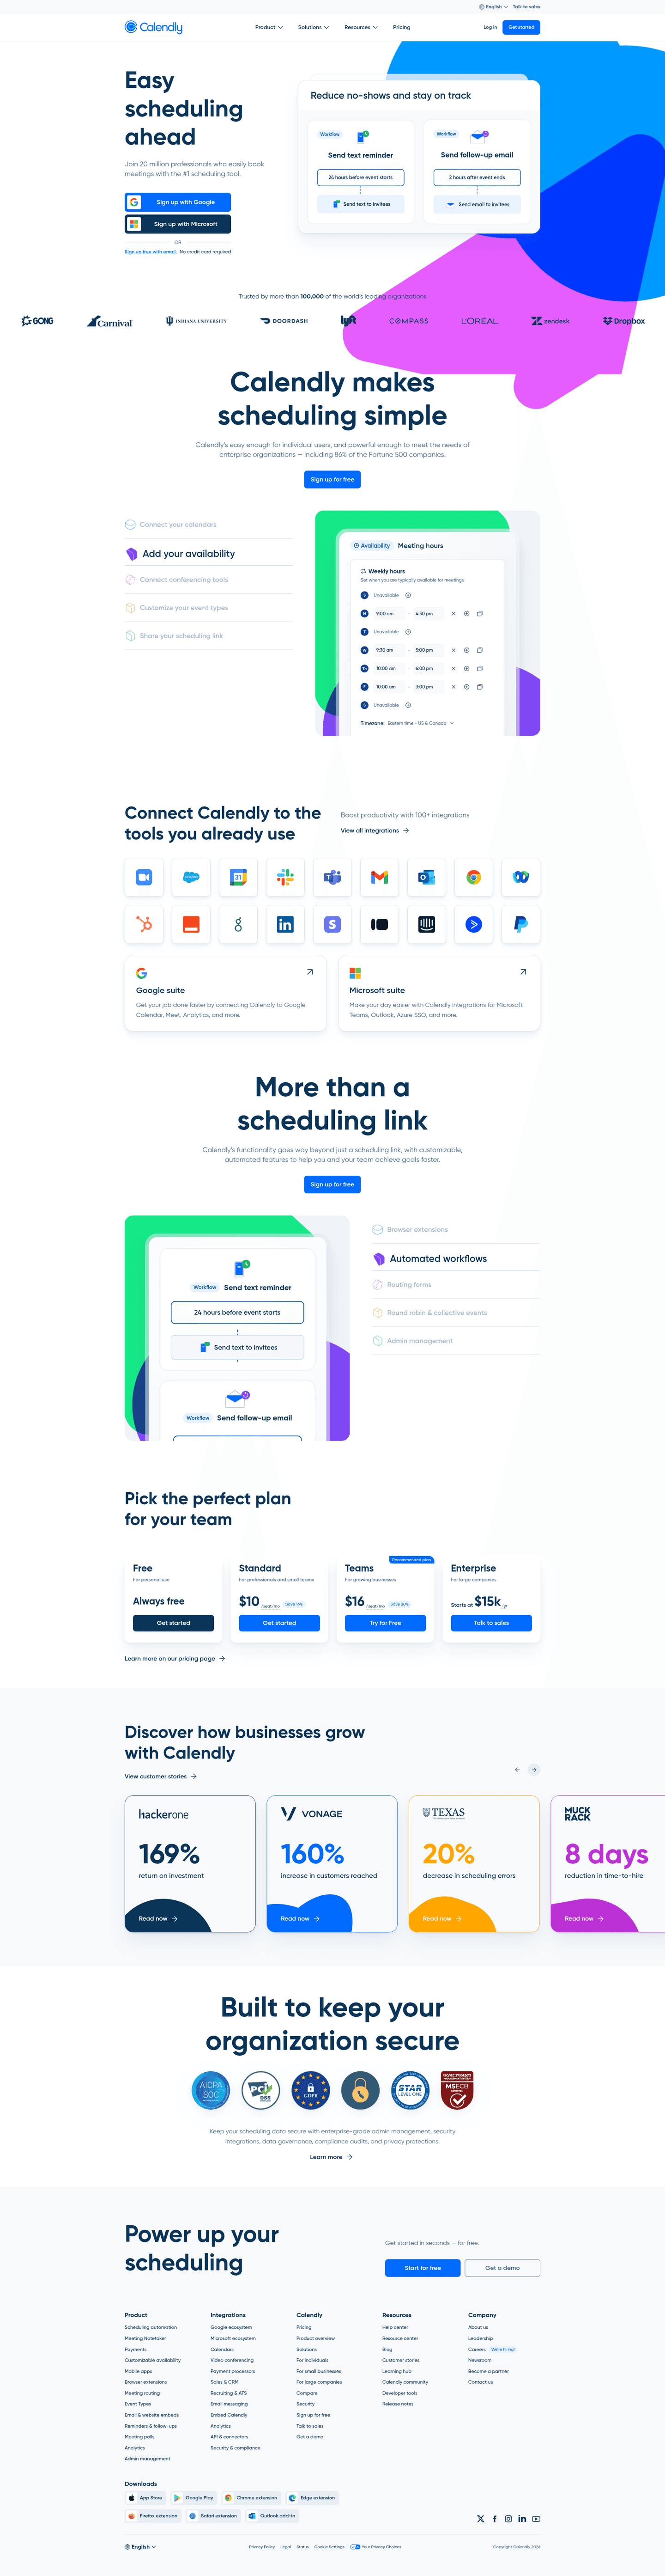
13% name the alternatives in a table, on their own homepage.

A hero the visitor can use
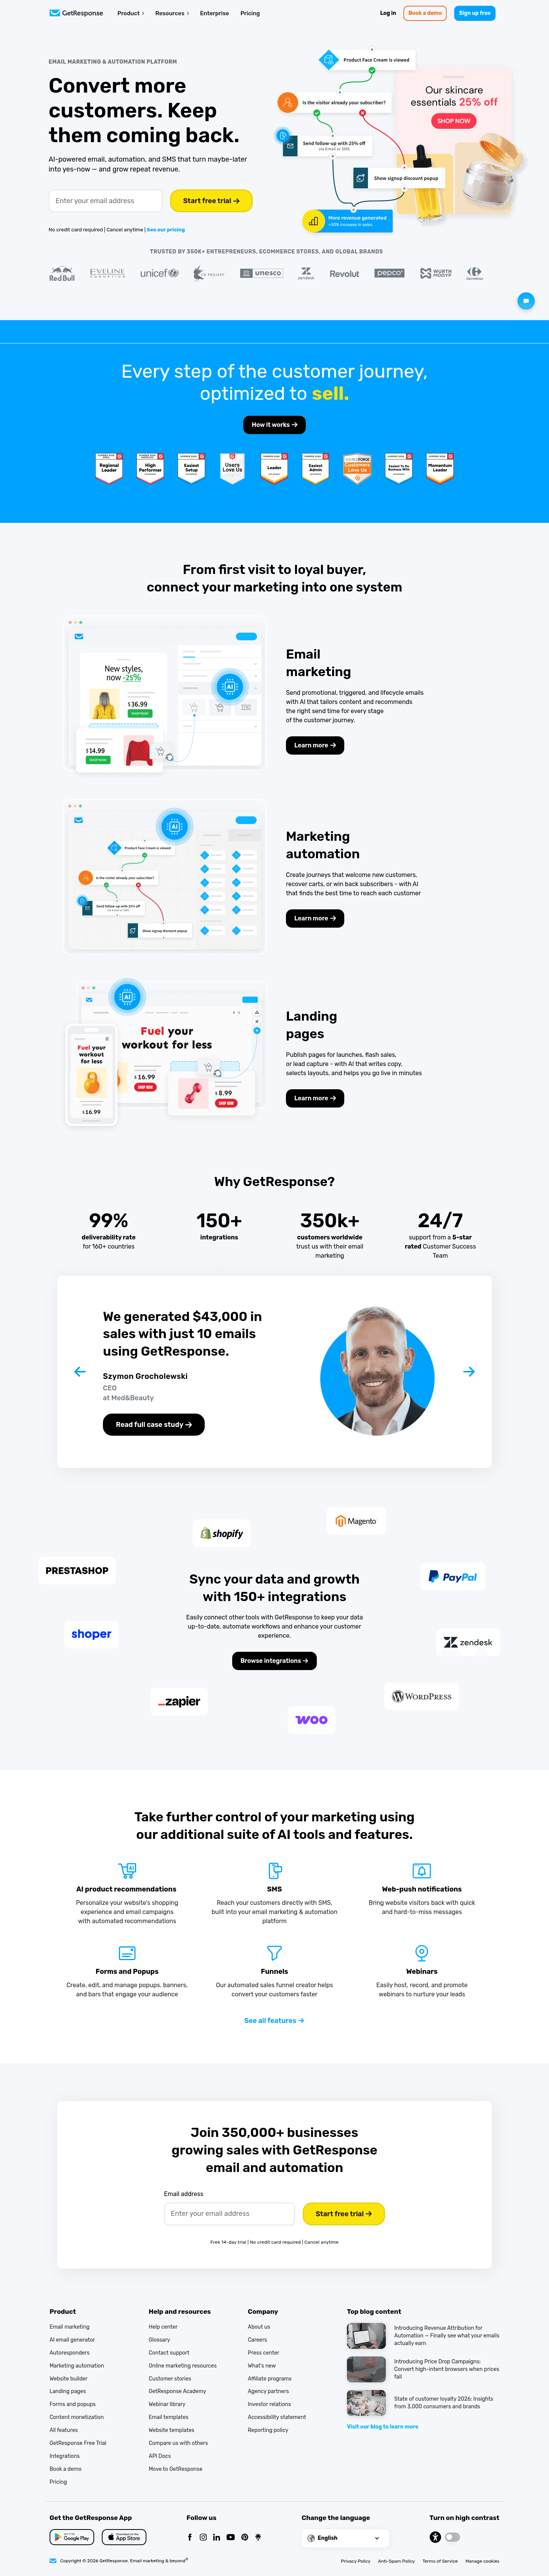
9% open with something to try before signing up: a prompt box, a URL field, a live demo.

Email capture in the hero
6% put the email field in the hero, ahead of the signup flow.

Curated by
Gabriel Amzallag , Founder, Web Anatomy
5 years CRO + SEO at Qonto (2021–2025). After advising 15+ SaaS on their websites (Payfit, Pigment…), the same patterns kept breaking, so I decided to build the source of truth on what works on the web: the intelligence layer every tool, builder, and team uses to ship sites that perform.
Go further than homepages
MCP
Section ideas, from inside your editor
Ask your coding agent for the strongest sections of a homepage in your industry. It answers from this benchmark, section by section.
Library
The analysis behind every page here
Each homepage on this page, section by section, with what works and what does not. Free account.
Didn't find the homepage you were looking for?
Every other page type has its own gallery. Or drill into one section, or jump to an industry view. Start from all page types.
- SaaS
- B2B
- AI
- Software
- Developer Tools
- Marketing
- Productivity
- Analytics
- Fintech
- Lead Generation
- CRM
- Operations
- HR Tech
- Cybersecurity
- Knowledge Management
- Social Media
- Accounting
- Design Tools
- Community
- Creator Economy
- No-Code
- Ecommerce
- EdTech
- Open Source
- Data
- Startup
- CMS
- Event Tech
- Healthcare
- Product Management
- InsurTech
- Telecom
- Agency
- Customer Support
- Blockchain
- ERP
- ESG
- IoT
See how your own homepage compares
Paste a URL and get a scored breakdown against the same best practices, with the fixes ranked by impact. Free, no signup.
Homepage design, answered
The questions people ask before rebuilding a homepage, answered from 574 real ones.
What should a homepage include?
01Across 574 homepages, four things are close to universal: a call to action in the navigation (84%), customer testimonials (74%), a customer logo wall (74%), and a pricing link in the nav (62%). Those are table stakes. A visitor notices their absence more than their presence, so the design decisions that matter are further down the list.
Should the homepage show pricing?
02Most do not. Only 13% of the homepages here put real prices on the page and only 8% carry a full pricing section, while 62% link out to a separate pricing page instead. Showing prices on the homepage is a deliberate minority choice, usually made by products with one simple plan.
What makes a homepage stand out?
03The rare moves, because almost nobody makes them. An interactive hero call to action appears on 9% of these homepages, email capture in the hero on 6%, and a chat widget on 7%. A number in the hero, the kind of concrete proof that replaces an adjective, shows up on 30%.
How many homepages mention AI?
04Just under half. 49% of these homepages name AI in the hero headline or the line under it. It is the fastest-moving pattern in the set and the one most likely to date a page, since a headline that leads with the technology says less than one that leads with the result.
What does a homepage hero usually show?
05Product UI, on 58% of them. Illustration comes second at 14% and photography third at 11%. 8% run a hero with no media at all, which is almost always a type-led design carried by the headline.
How is this different from the best landing pages leaderboard?
06This gallery is a visual browse: what homepages look like and what they contain. The best landing pages benchmark is the graded view, where pages are scored against conversion best practices and ranked by industry. Same companies, different question.
