We scored 15 data and analytics homepages on 60+ conversion criteria. See which sections separate the top performers, and what your page is probably missing.
What high-performing data homepage design gets right
Data pages sell to technical buyers who evaluate tools methodically. The strongest pages in this benchmark do four jobs early:
52/100
Avg. page score
Make the data use case obvious in the first viewport so the buyer knows whether this is a pipeline tool, analytics platform, visualization layer, or data warehouse.
Show the product as a real data workflow so the promise feels operational instead of abstract.
Layer trust cues early with integration logos, customer data volumes, or recognizable enterprise clients.
Give data teams a low-friction next step with a free tier, sandbox, or interactive product tour.
Top data homepage analyzed in detail
Each company below is paired with its strongest section and scored across 60+ conversion criteria. See what they get right, and what you can borrow.
01
Invofox Self Serve
Editor's pick67/100
Section we love
·Value Proposition
1Two oversized figures carry the pitch: '99.2% accuracy guaranteed' and '$0 if we make a mistake'
2Accuracy is backed by contract ('part of our SLAs'), turning a marketing claim into an obligation
3Mistakes reported via the API are credited back automatically, explaining how the 'pay only for correct data' promise works
4'Pay per page. No credits, no math.' bar with 'See pricing' carries the risk-free framing into the next step
02
Firecrawl, Web data extraction for developers and AI pipelines.
5 years CRO + SEO at Qonto (2021–2025). After advising 15+ SaaS on their websites (Payfit, Pigment…), the same patterns kept breaking, so I decided to build the source of truth on what works on the web: the intelligence layer every tool, builder, and team uses to ship sites that perform.
“Developer-first data extraction with strong product visuals. Firecrawl pairs clear API documentation with conversion-focused CTA placement and feature sections that make the developer experience tangible.”
What makes this page stand out
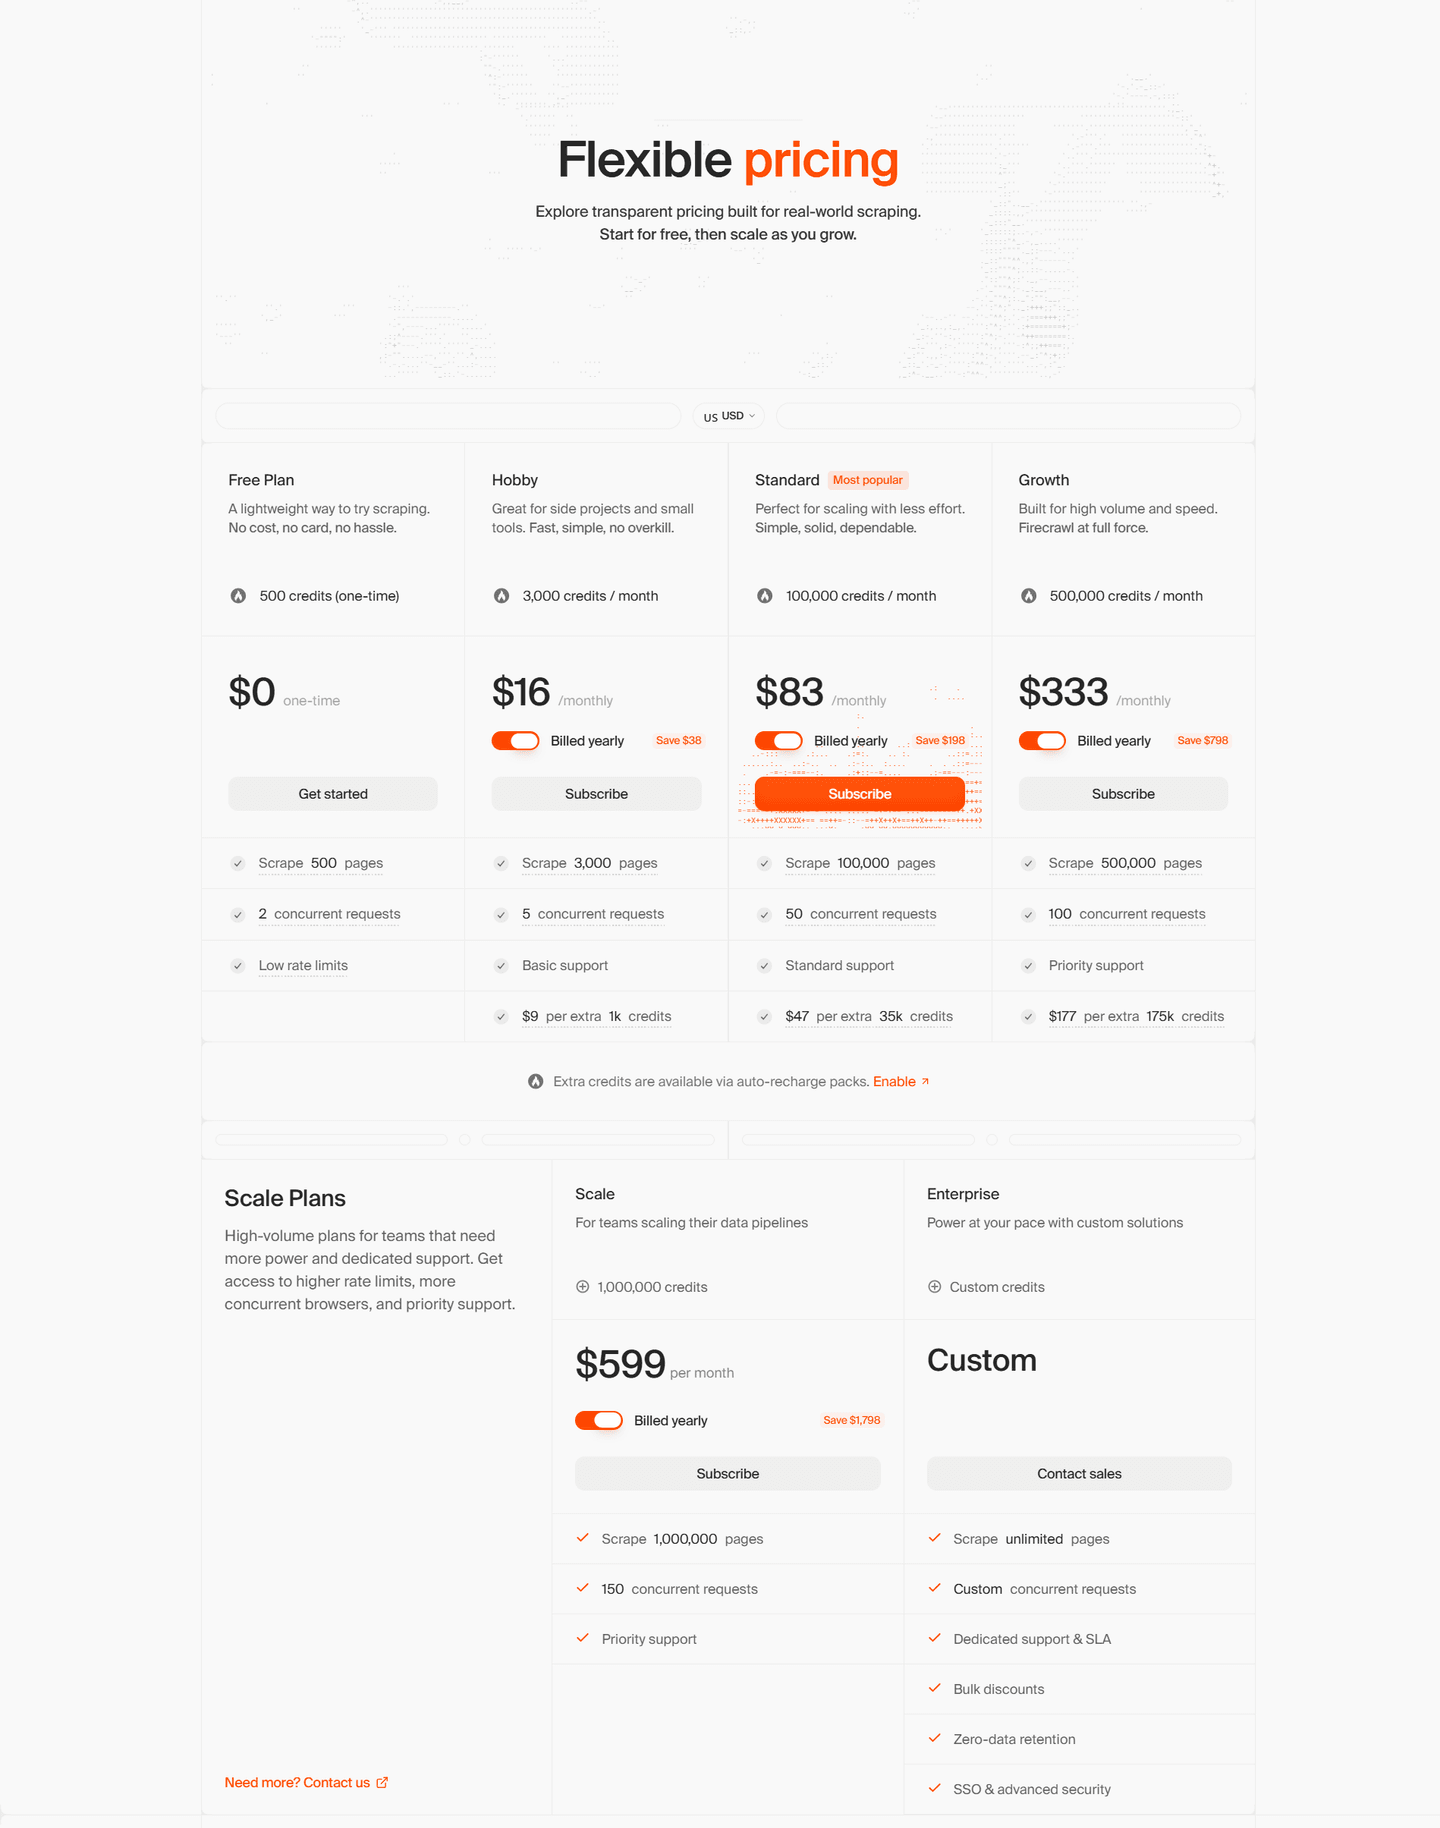
A pricing promo link offers “2 Months Free — Annually” directly from the header area.
The hero headline says “Power AI agents with clean web data” and highlights “It’s also open source.”
The trust strip claims “Trusted by 150,000+” and shows logos like Shopify, Canva, Apple, and Zapier.
The performance section cites 96% web coverage and P95 latency of 3.4s, linking to “See benchmarks”.
Section we love
·Cta
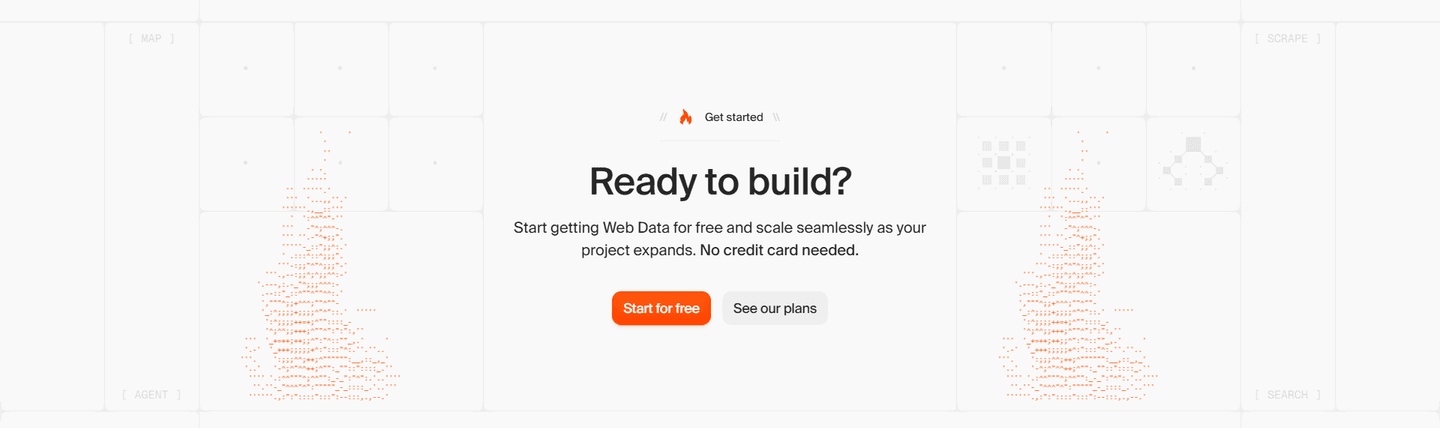
1Dominant orange Start for free button is clearly primary over the muted gray secondary
2Action-led copy (Start for free) tells the visitor the exact next step
3Reassuring microcopy (No credit card needed) sits right above the buttons to kill last-minute doubt
4Lower-commitment second path (See our plans) catches visitors not ready to sign up yet
03
Hightouch
57/100
What makes this page stand out
The hero headline “Marketing looks different here” is repeated twice above the same subhead and “Get a demo”.
The hero uses a three-slide background carousel and rotating ad-card visuals, with keyboard navigation instructions displayed.
Customer logos sit under “The world’s most innovative companies choose Hightouch,” including Spotify, Grammarly, Domino’s, DoorDash, and PetSmart.
The “Reinvent the way your marketing team works” section splits into AMP and Composable CDP cards with distinct CTAs.
Section we love
·Integrations
1Headline leads with the number (Connect to 300+ tools), so ecosystem scale lands in one read
2Three rows of known logos (Meta, Slack, Salesforce, Amazon, Adobe, Oracle) prove the claim at a glance
3See all integrations button gives a clear path to the full directory
4Subline ties the logos to jobs: activate audiences, lifecycle and ad campaigns across any tool
04
Secoda
48/100
What makes this page stand out
The hero headline reads “The AI platform for data and analytics” followed by governance copy about “trusted answers fast and at scale.”
The primary CTA is “Learn more” and routes to /contact-sales, pushing sales conversations over self-serve signup.
The hero uses an autoplaying video module (with “Tap to unmute”) instead of a static product screenshot.
The feature section uses four icon tabs—Discover, Catalog, Monitor, Govern—each with one-line benefit copy.
Section we love
·FooterBest in class
1Six labeled columns (Product, Solutions, Use cases, Resources, Company, Social) map the whole site by role and task
2Newsletter block (Stay in the know) with an inline email field and Subscribe button catches visitors not ready to buy
3AICPA SOC 2 seal sits beside Snowflake Data Partner and Modern Marketing Data Stack 2026 badges as a last trust check
4Resources column links comparison pages (Secoda vs. Atlan, vs. Collibra) and an ROI calculator for late-stage buyers
05
Alteryx
46/100
What makes this page stand out
Alteryx One unification narrative (analytics + AI + governance) positions as the single pane of glass — in a fragmented data tool landscape, "one seamless platform experience" directly addresses tool sprawl fatigue
"Code-free analytics automation" expands the buyer persona beyond data engineers — empowering business analysts to self-serve reduces bottleneck dependencies and resonates with business unit leaders frustrated by IT backlogs
Alteryx Copilot AI assistant modernizes the user experience — AI-powered workflow creation captures the generative AI momentum while grounding it in practical analytics automation use cases
Deep platform integrations (Snowflake, Databricks, OpenAI) positions Alteryx as the workflow layer — rather than competing with data platforms, Alteryx orchestrates across them, making it complementary rather than competitive
Section we love
·Resources
1One large featured article (The Logic Layer) plays against a stacked side list, creating clear visual priority
2Every article maps to the product domain (AI governance, data readiness, analytics) so resources reinforce the core value prop
3Category tags (Technology, People, Strategy) plus (Read More) links route readers deeper into the content funnel
4Thought-leadership angles (The Missing Piece in Modern AI Tech Stacks, AI Data Readiness) position Alteryx as an authority
Design patterns we see across high-performing data pages
Across 15 data pages reviewed, the pages that convert tend to make the first screen do one job: name the data use case and show the product handling real data workflows.
The strongest patterns pair clear technical claims with product visuals that feel real, then back those claims with integration logos and enterprise client examples that data teams can verify. Data website design works best when it bridges the gap between infrastructure complexity and visible output. Use website section examples to compare how these building blocks show up across page types.
1Video testimonial with a play button puts a real PetSmart leader on camera
2Each card captions a measurable result, e.g. personalizing journeys for 70 million loyalty members
3Company logos (PetSmart, Otrium) sit on each video so the brand reads before the quote
4'Read story' buttons lead to full case studies behind every video card
Reviewed design-pattern pick from Hightouch’s testimonial section.
What I love about this section
Video testimonial with a play button puts a real PetSmart leader on camera
Each card captions a measurable result, e.g. personalizing journeys for 70 million loyalty members
Company logos (PetSmart, Otrium) sit on each video so the brand reads before the quote
'Read story' buttons lead to full case studies behind every video card
Overlooked sections that quietly drive clarity and trust
In this set, pricing, FAQ, and footer sections often do more conversion work than teams expect: they shape evaluation decisions, answer common technical questions, and keep the buying journey coherent for methodical evaluators.
The biggest gaps usually appear where the page should explain pricing tiers and integration fit clearly. When those sections are thin, data teams stall because they cannot evaluate total cost and technical compatibility.
How Invofox Self Serve closes the page with confidence
1Five labelled columns split links by Product, By document, By industry, Resources and Company
2SOC 2, GDPR and ISO 27001 badges sit in their own row above the copyright line
3By document and By industry columns double as SEO entry points (Invoice OCR, Mortgage and lending)
4Privacy, Terms and Cookies links stay visible in the bottom bar
Reviewed overlooked-section pick from Invofox Self Serve’s footer section.
What I love about this section
Five labelled columns split links by Product, By document, By industry, Resources and Company
SOC 2, GDPR and ISO 27001 badges sit in their own row above the copyright line
By document and By industry columns double as SEO entry points (Invoice OCR, Mortgage and lending)
Privacy, Terms and Cookies links stay visible in the bottom bar
Use the examples below as prompts for what to standardize, not just what to redesign.
Checklist: a practical audit for data website design
If you are iterating on a data homepage design, this checklist helps you spot missing sections and messaging gaps quickly, especially around Value Proposition, Cta, and Hero.
Run it on your current page, then decide what to rewrite, what to reorder, and what proof to add before you touch visual polish. For a faster baseline, you can also try our landing page analyzer.
Interactive quiz
What would your data homepage score?
Question 1 of 5
0%
Can a data team identify what you do in under 5 seconds?
"Automated data pipelines for analytics teams" beats "unlock the power of your data."
Reviewed by
Gabriel Amzallag , Founder, Web Anatomy
5 years CRO + SEO at Qonto (2021–2025). After advising 15+ SaaS on their websites (Payfit, Pigment…), the same patterns kept breaking, so I decided to build the source of truth on what works on the web: the intelligence layer every tool, builder, and team uses to ship sites that perform.
Quick answers based on our data website benchmark dataset.
What are the best data websites?
[01]
The strongest performers in this November 2026 benchmark are Fivetran, Firecrawl, Databricks, and Snowflake, with Tableau leading on visualization-as-output and Splunk on observability. Across 15 data homepages scored against 60+ criteria, these pages convert by showing the workflow (pipelines, queries, or dashboards) instead of promising abstract platform power.
What makes data websites harder to convert than other B2B pages?
[02]
Data buyers are technical evaluators who need to see integration fit and the actual workflow before committing budget. Across 15 homepages reviewed, the pages that convert bridge infrastructure complexity with visible output: Firecrawl pairs API docs with product visuals to make the developer experience tangible, Fivetran puts the pipeline in the hero, and Snowflake treats performance as a concrete number instead of a claim.
What is the biggest design mistake on data homepages?
[03]
Leading with abstract platform language like "unlock the power of your data" instead of showing what the product actually does. The average page in this November 2026 benchmark scored 52. Top performers replace abstraction with proof: Fivetran shows the pipeline, Databricks segments features by technical role, and Tableau leads with the visualization output itself so a buyer can evaluate in ten seconds.
What sections should a data homepage include?
[04]
A hero that names the data use case, an early trust layer with integration logos or customer data volumes, a product workflow preview (pipeline view, query interface, or dashboard), use-case routing for engineers versus analysts versus scientists, and a low-friction CTA like a free tier or sandbox. Databricks segments roles well; Fivetran makes the pipeline the hero. Across 15 homepages, the pages that stack these blocks convert most.
How many data examples do I need to review before redesigning?
[05]
Three to five is enough if you pick by theme and compare section by section. Only 2% of homepages in this benchmark score in the top tier, so the gap is concentrated in a few blocks. Study Fivetran for pipeline clarity, Firecrawl for developer positioning, Databricks for multi-role segmentation, Snowflake for enterprise trust, and Tableau for output-first visualization.
Where can I find great inspiration for my data website?
Use a structured rubric that checks clarity, trust, and friction instead of relying on subjective feedback. Run your page through the landing page audit for a section-by-section score against the same 60+ criteria used in this benchmark.