New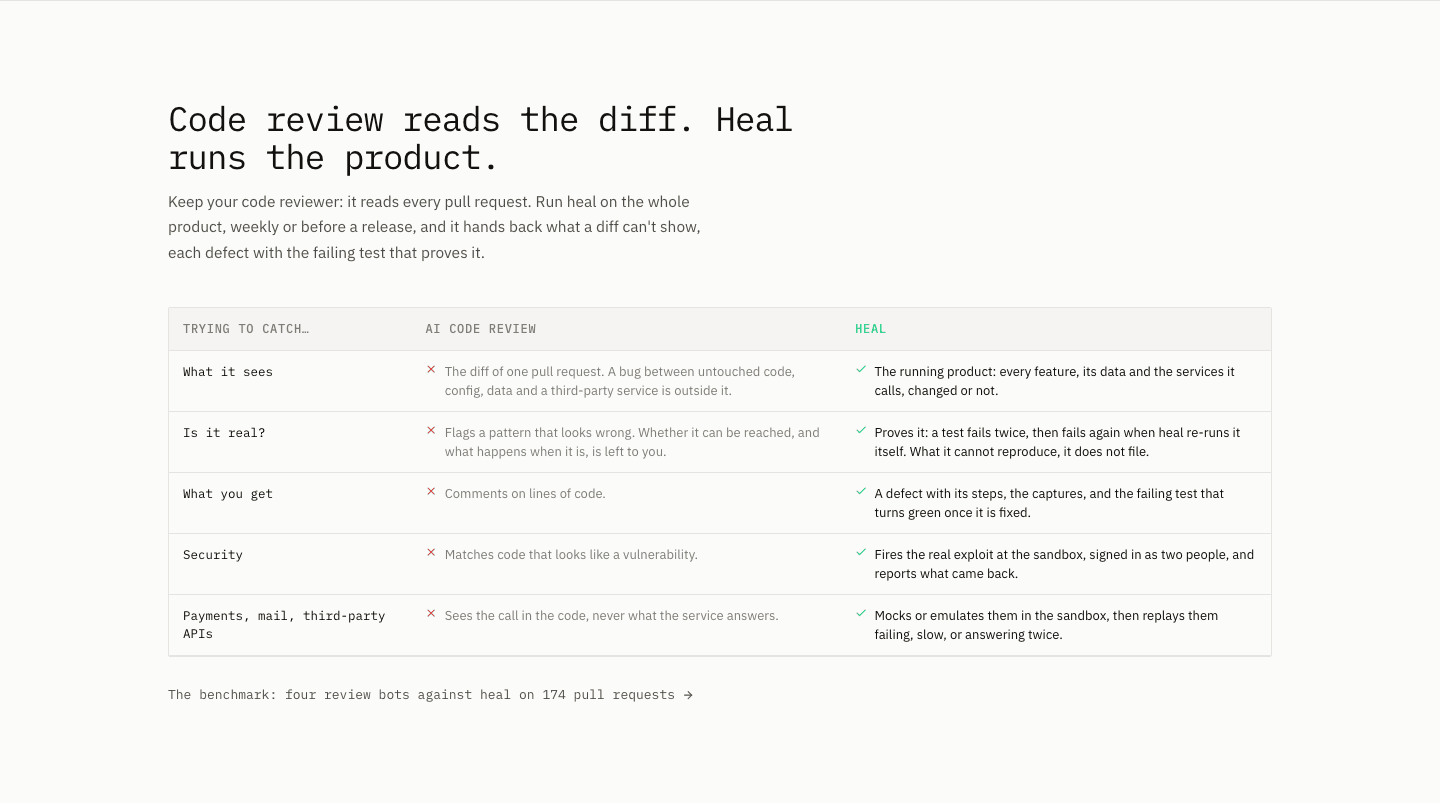
Comparison|
The comparison section shows buyers how you stack up against a named competitor, feature by feature. Explore 45 scored examples and see what the best do differently.
Updated November 2026
Showing 1–29 of 45 examples
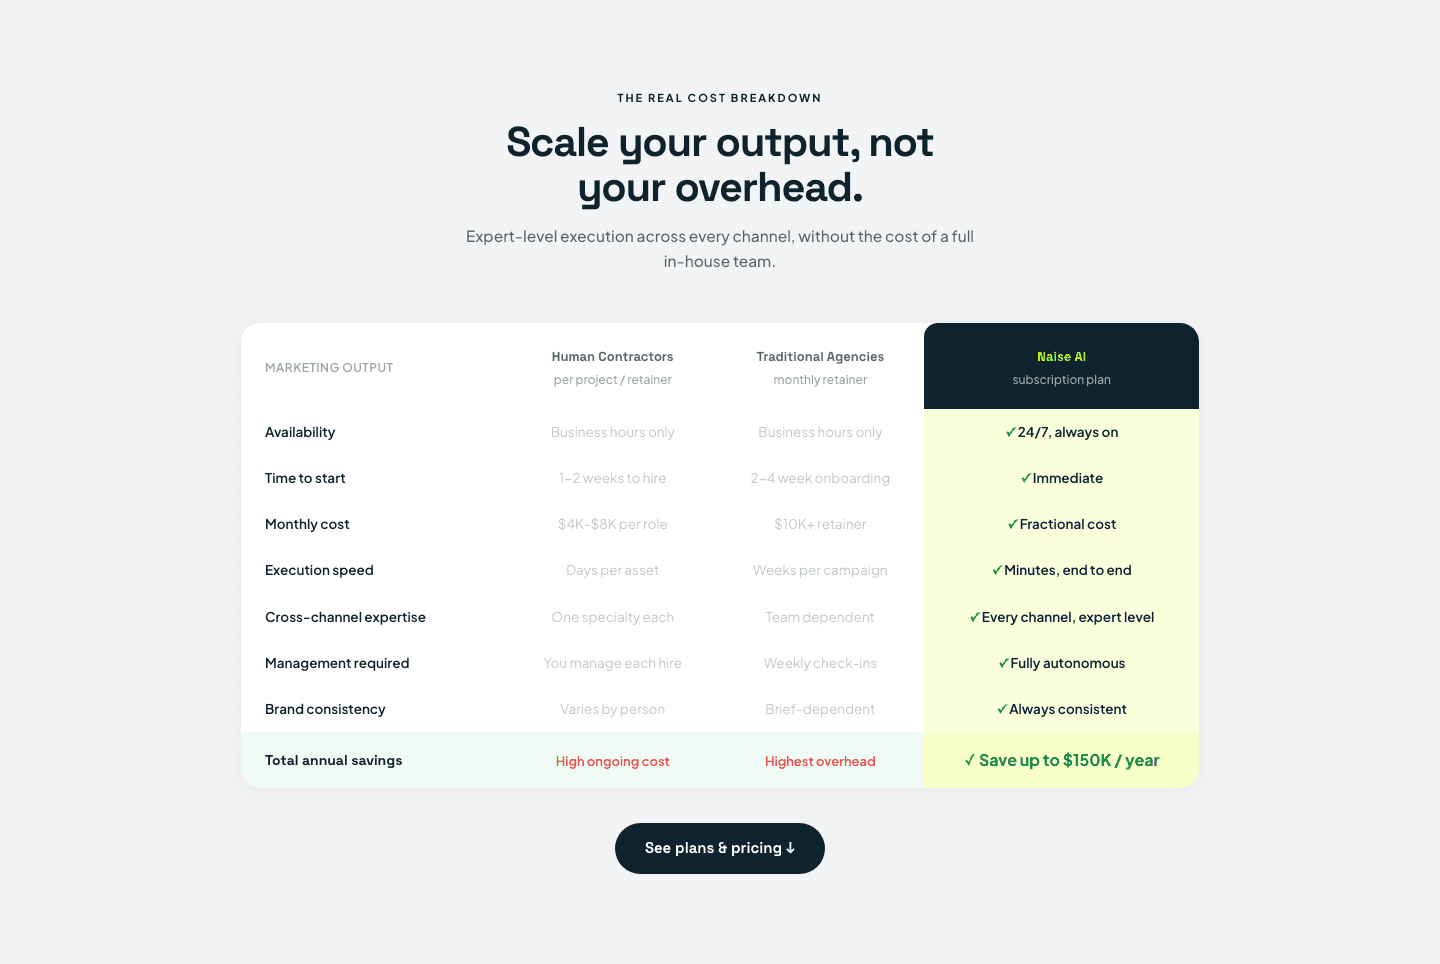
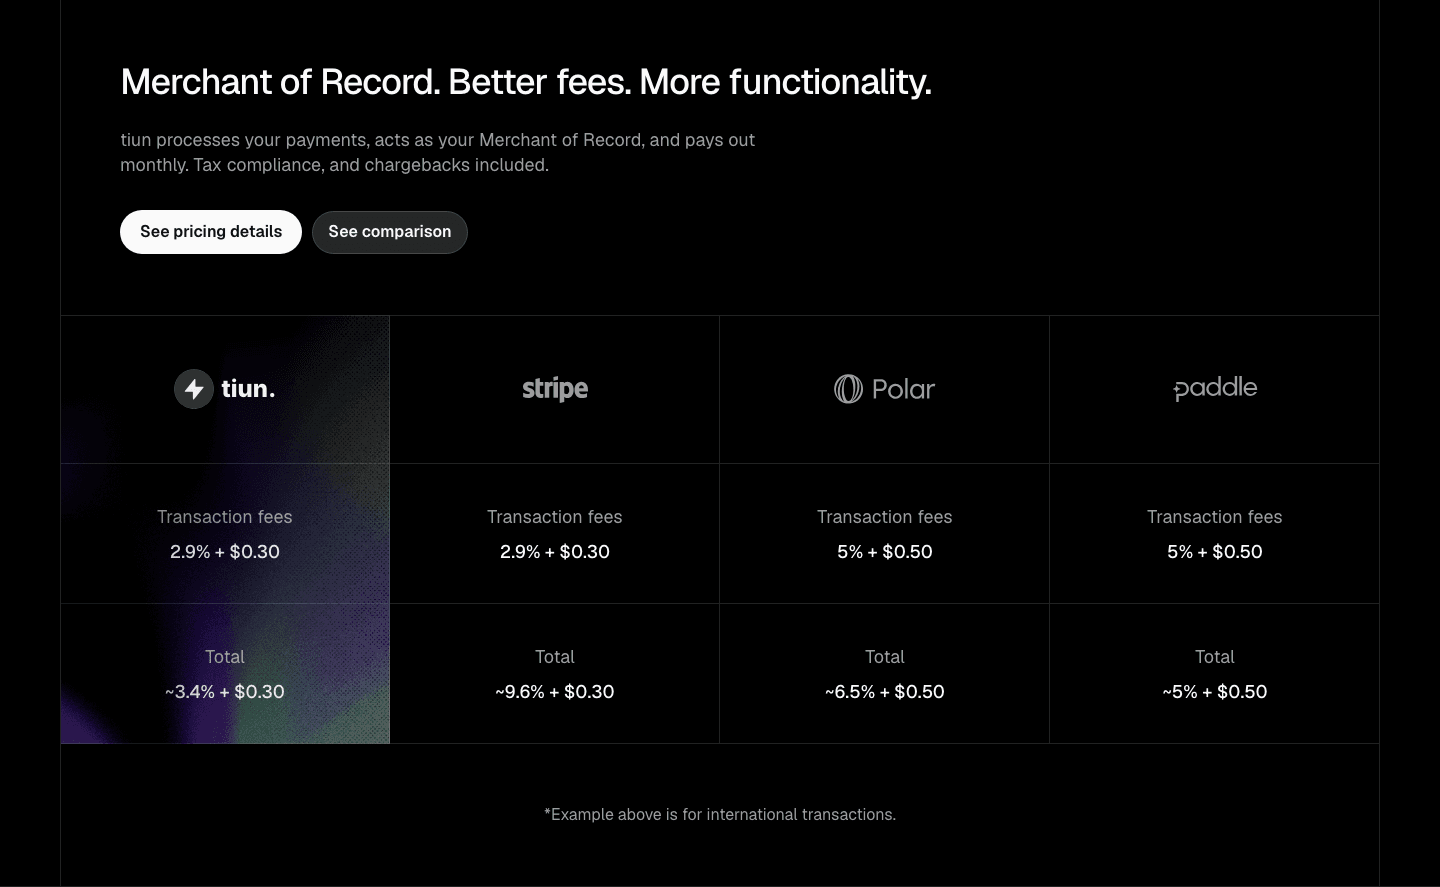
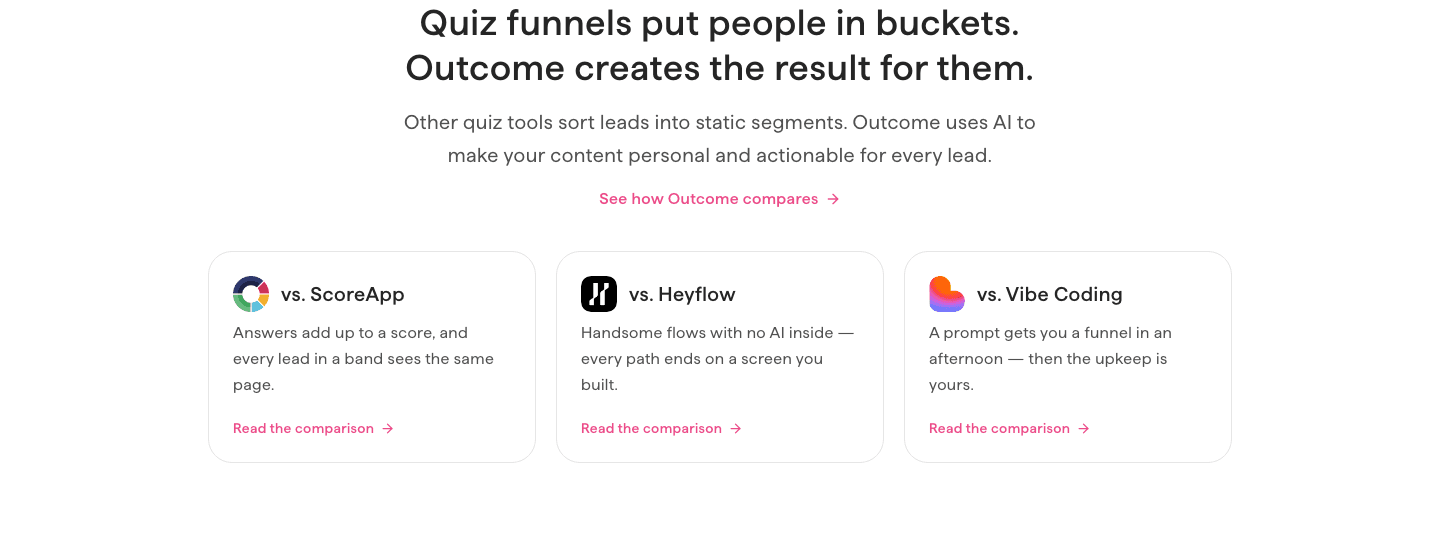
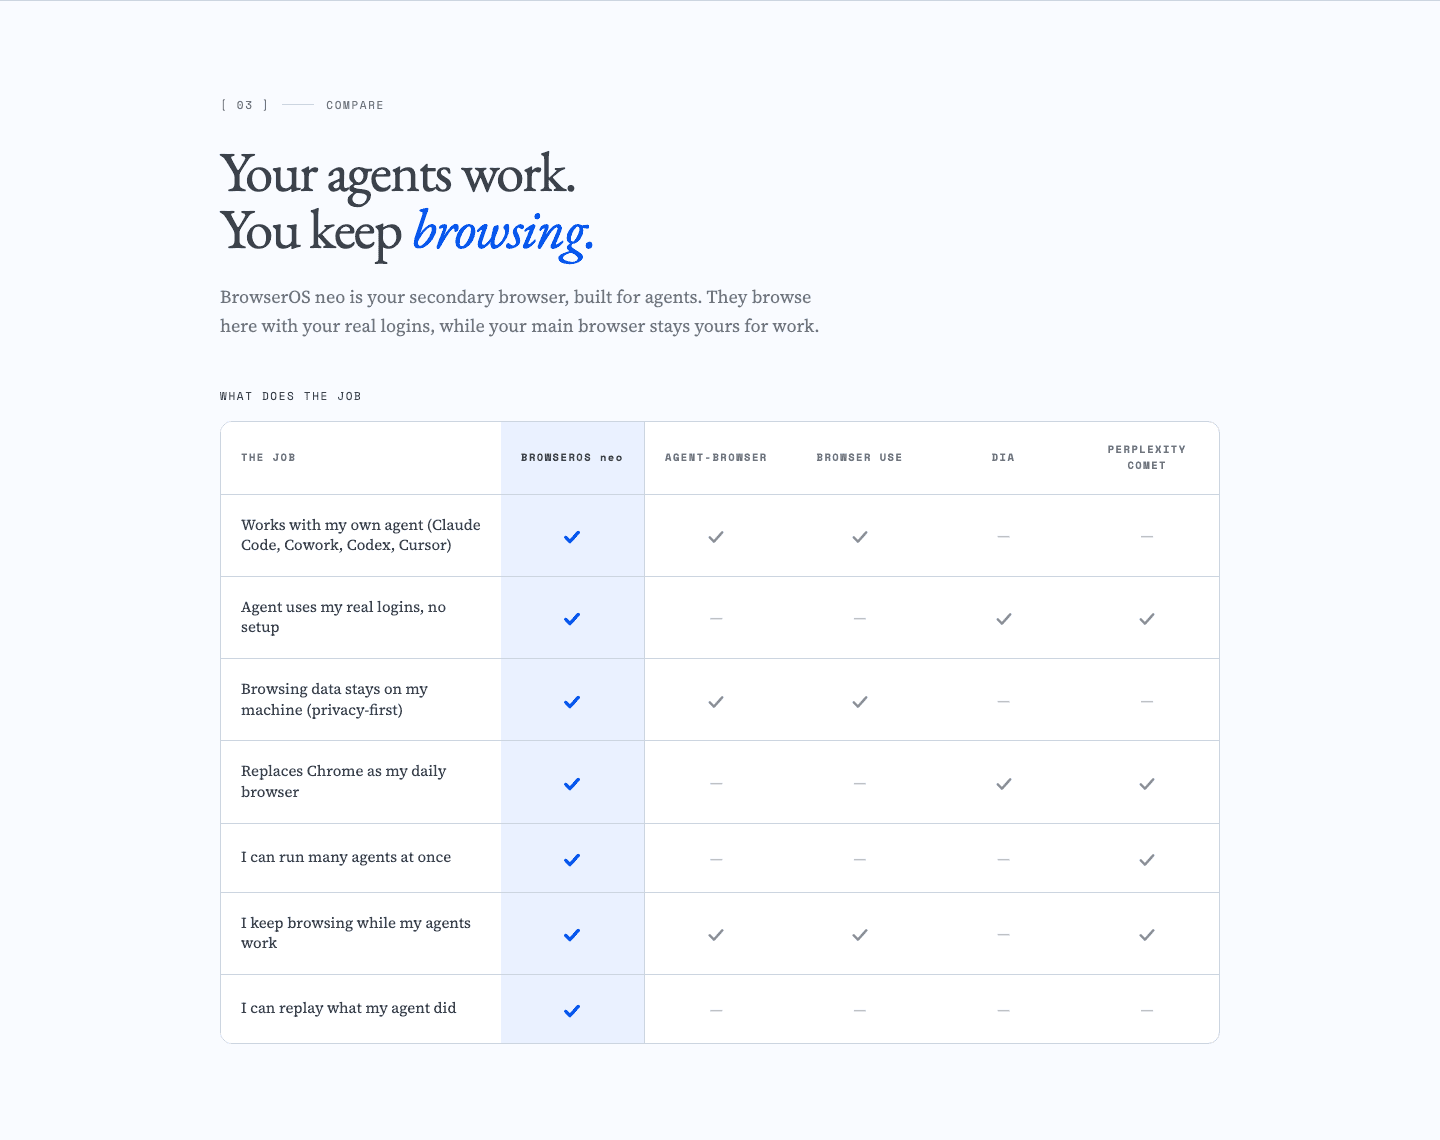
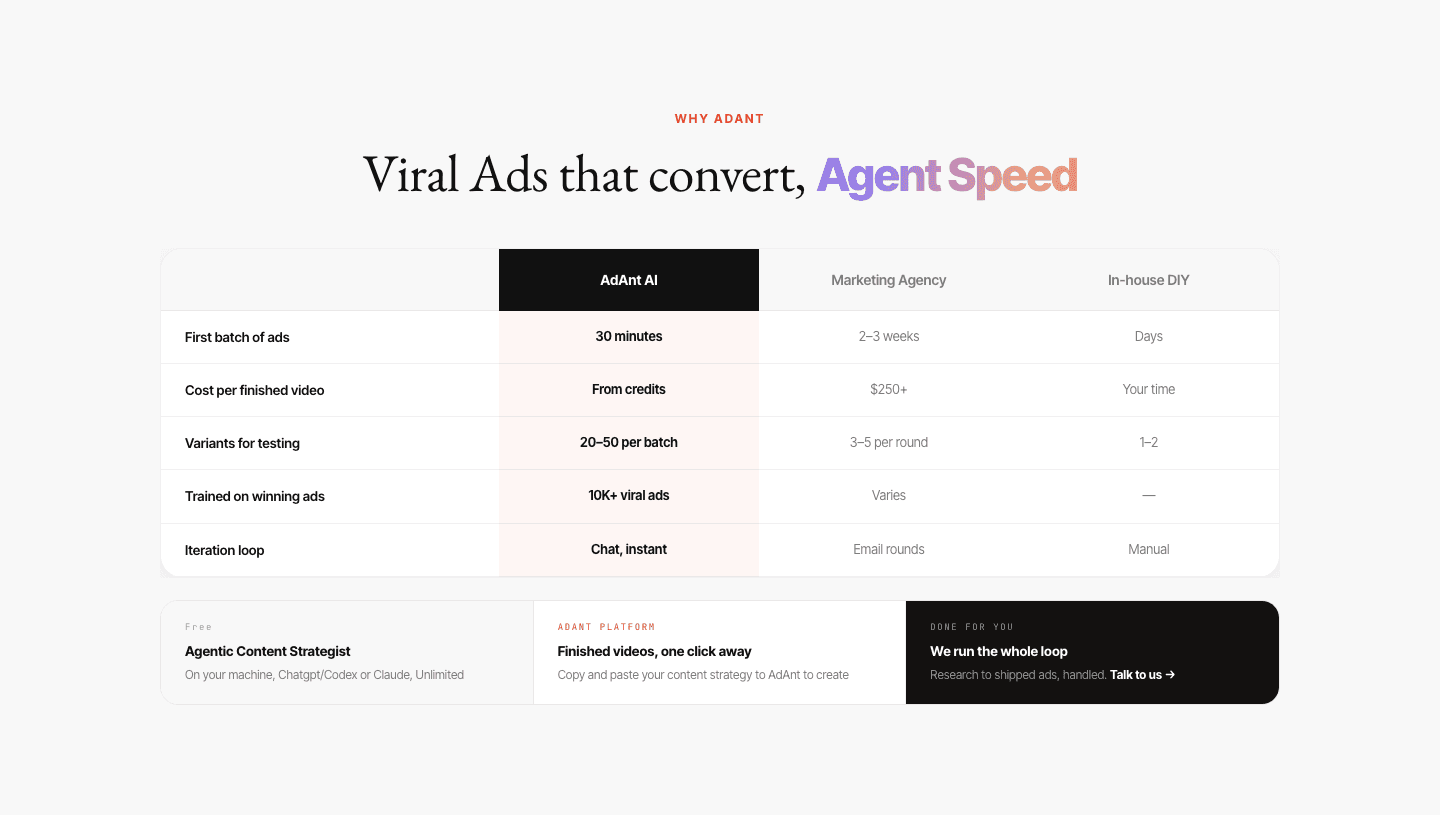
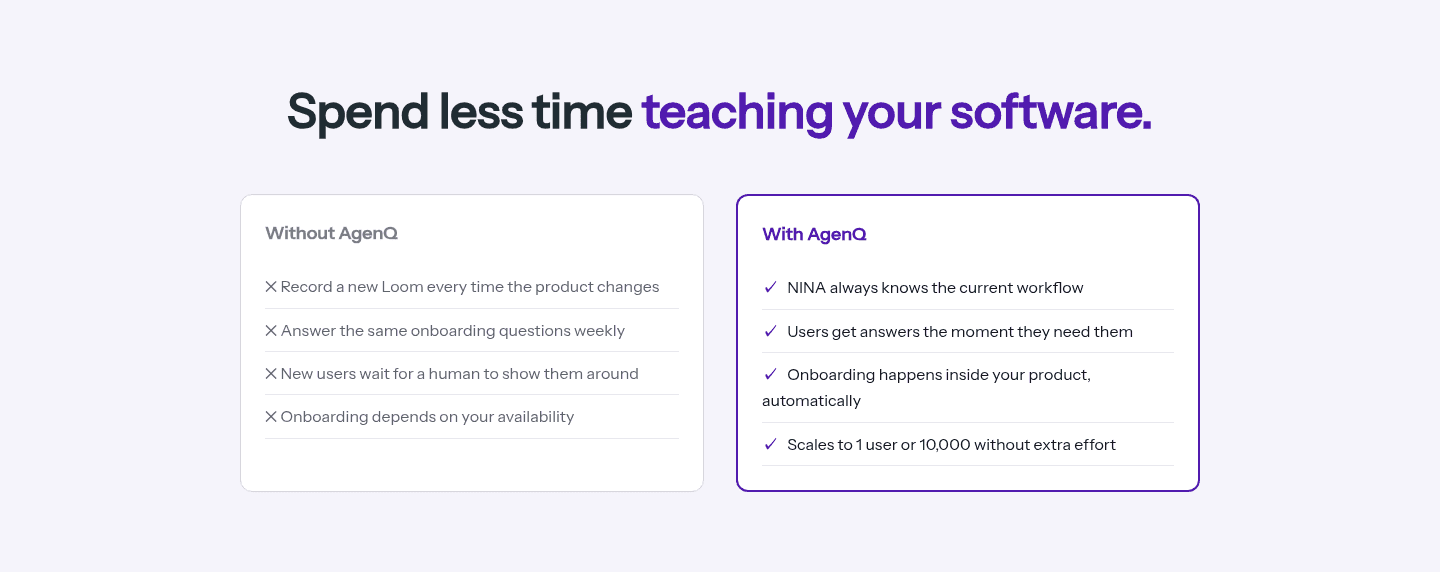
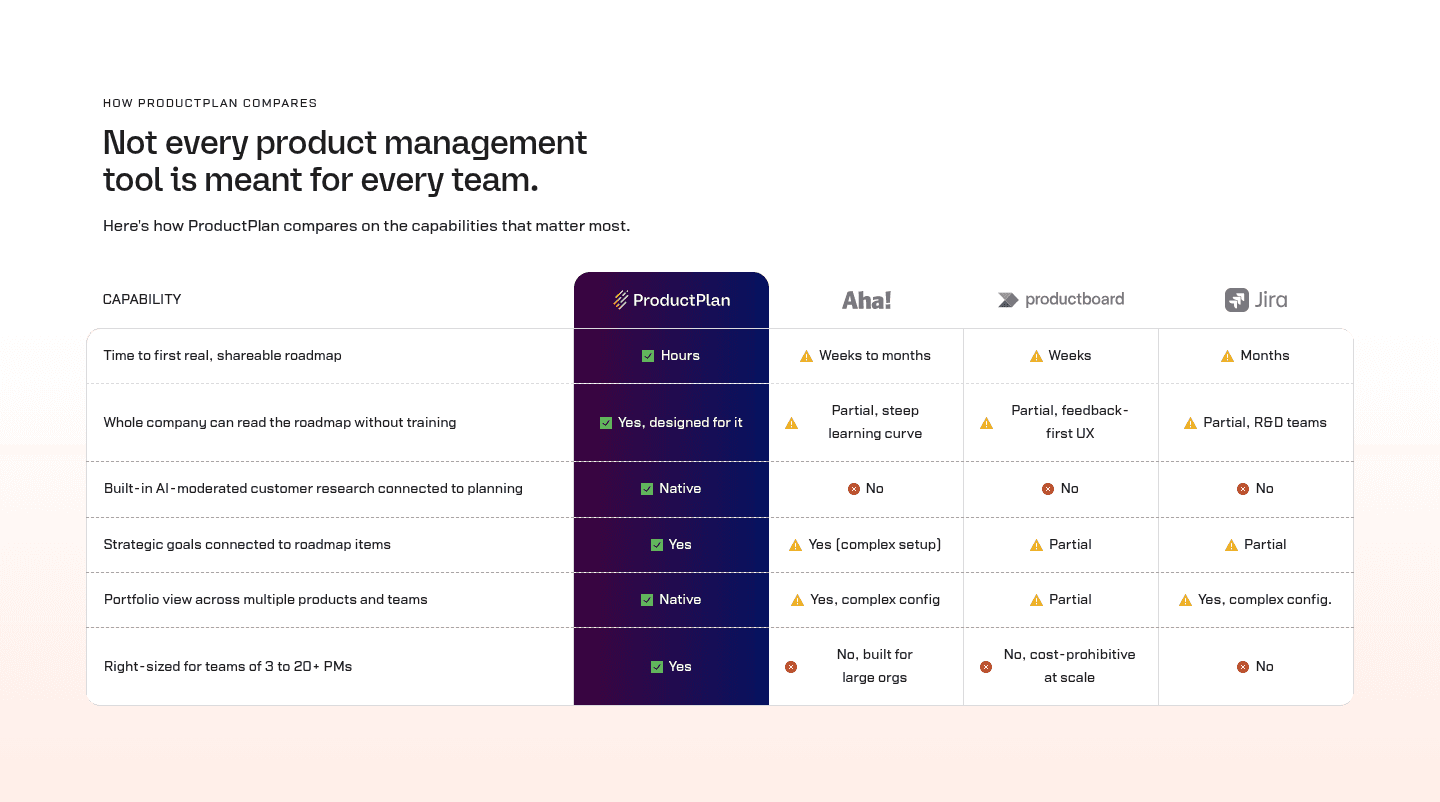

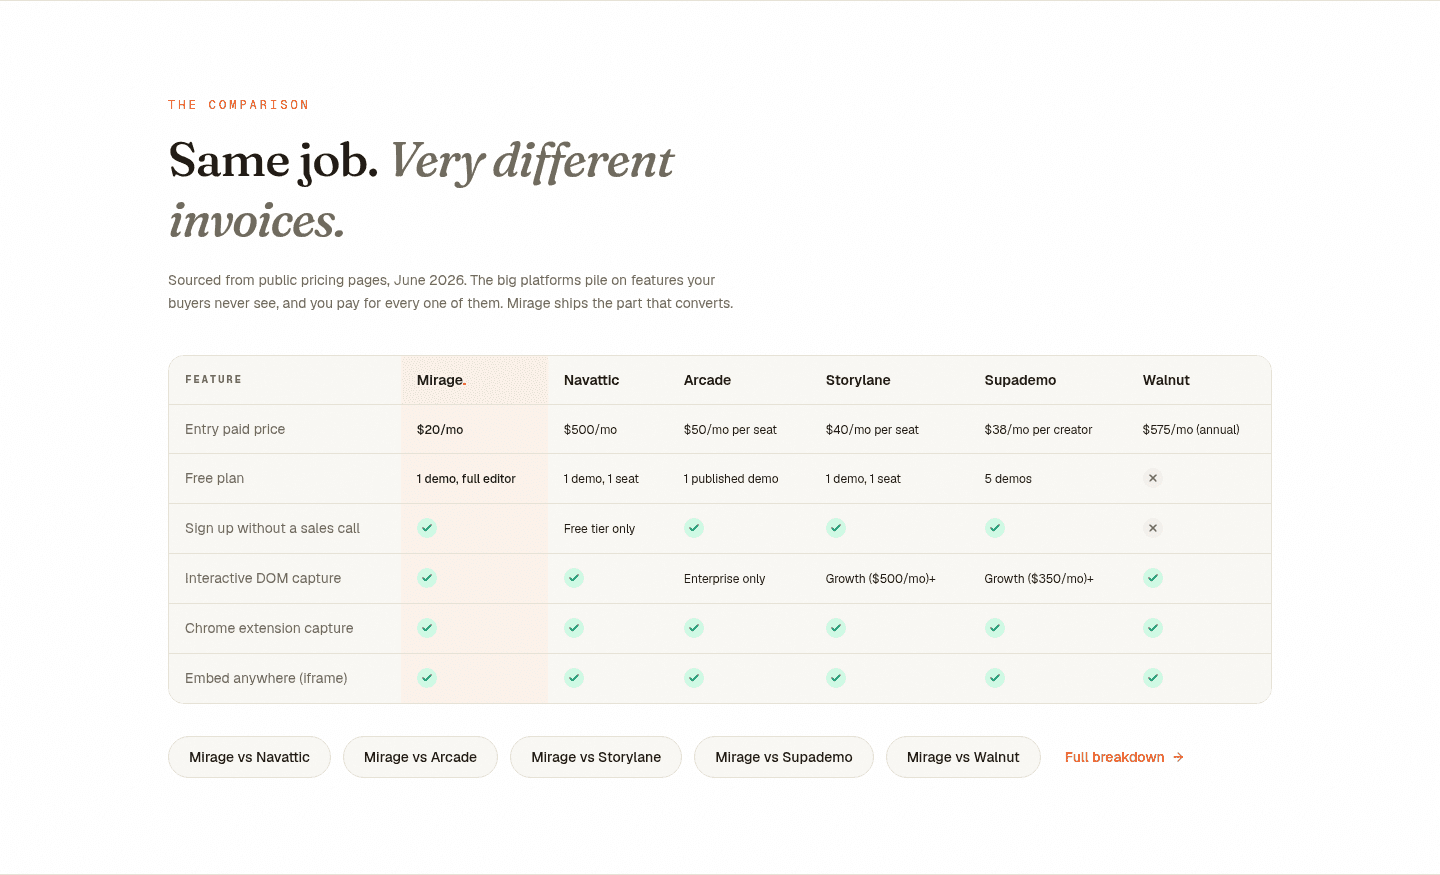
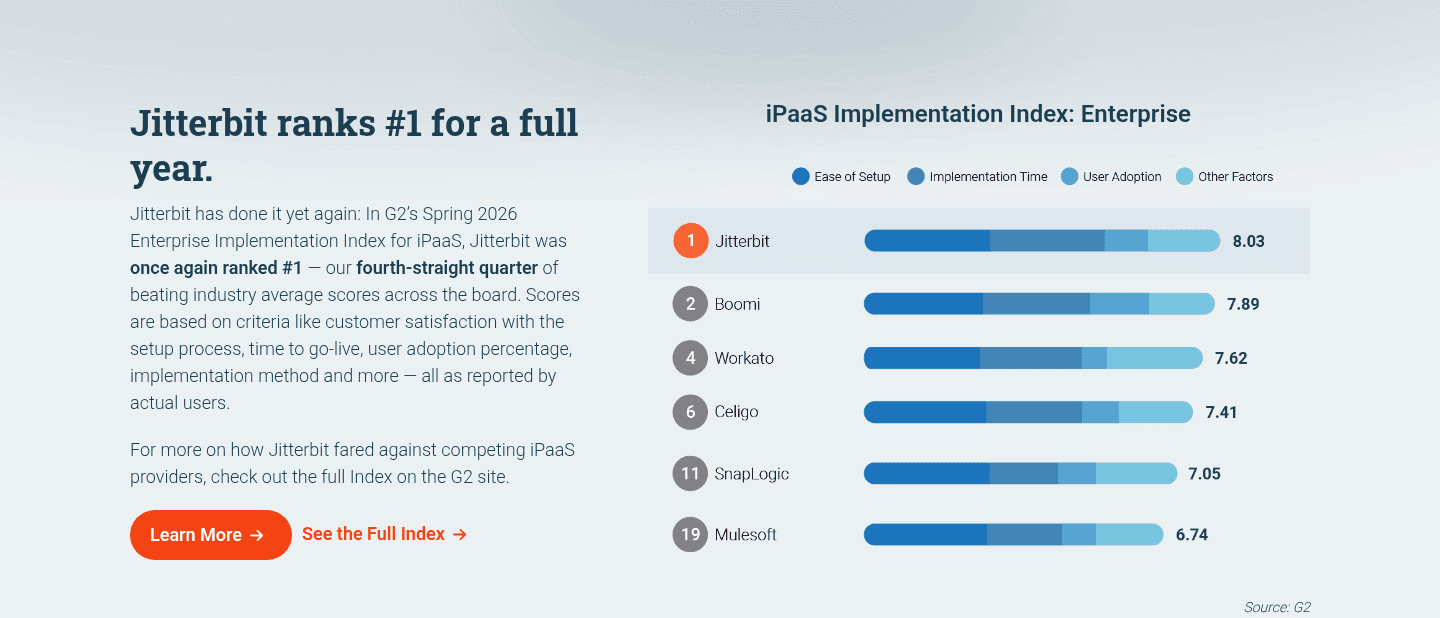
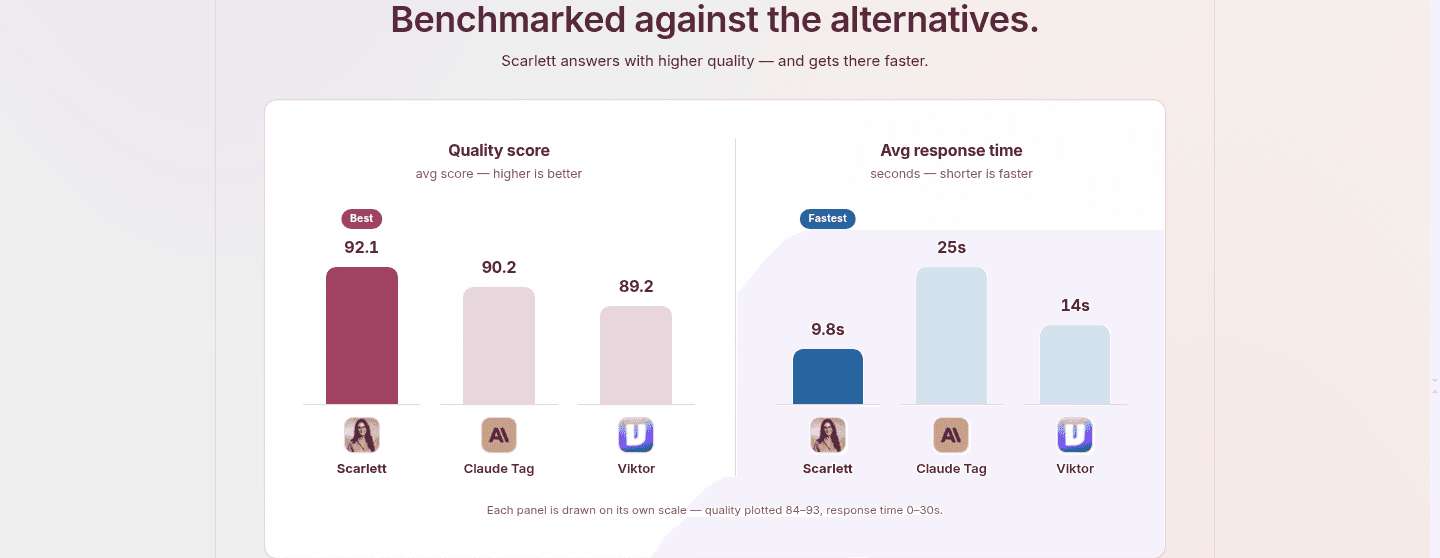
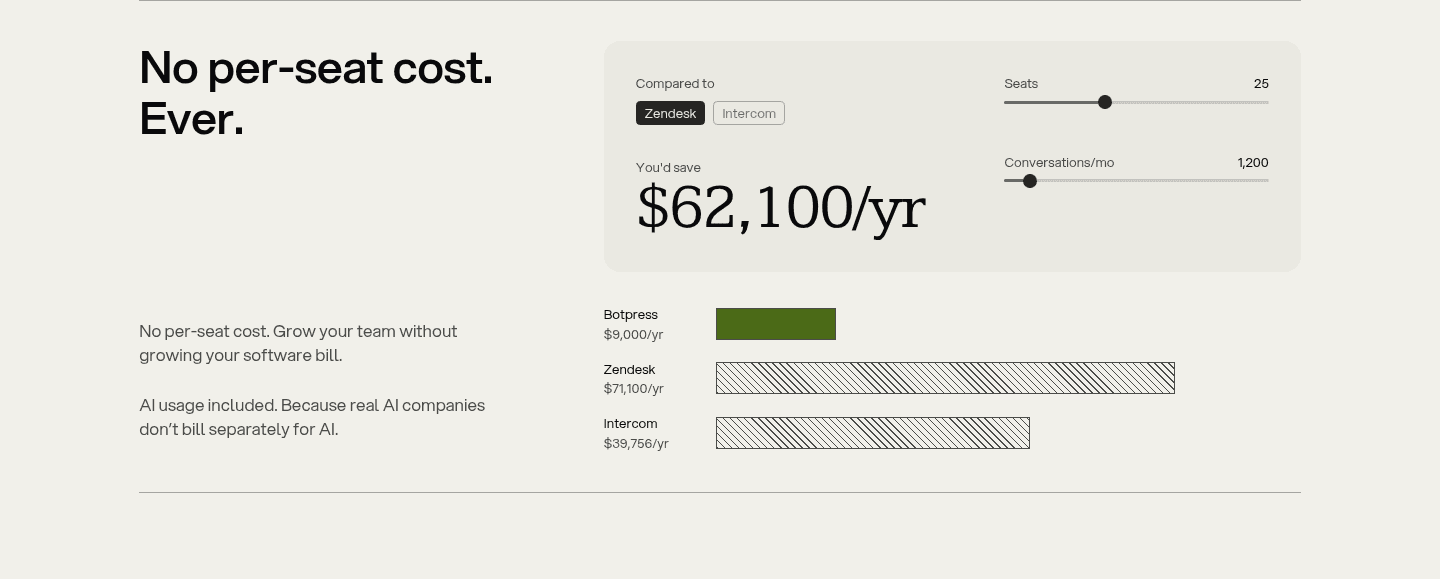
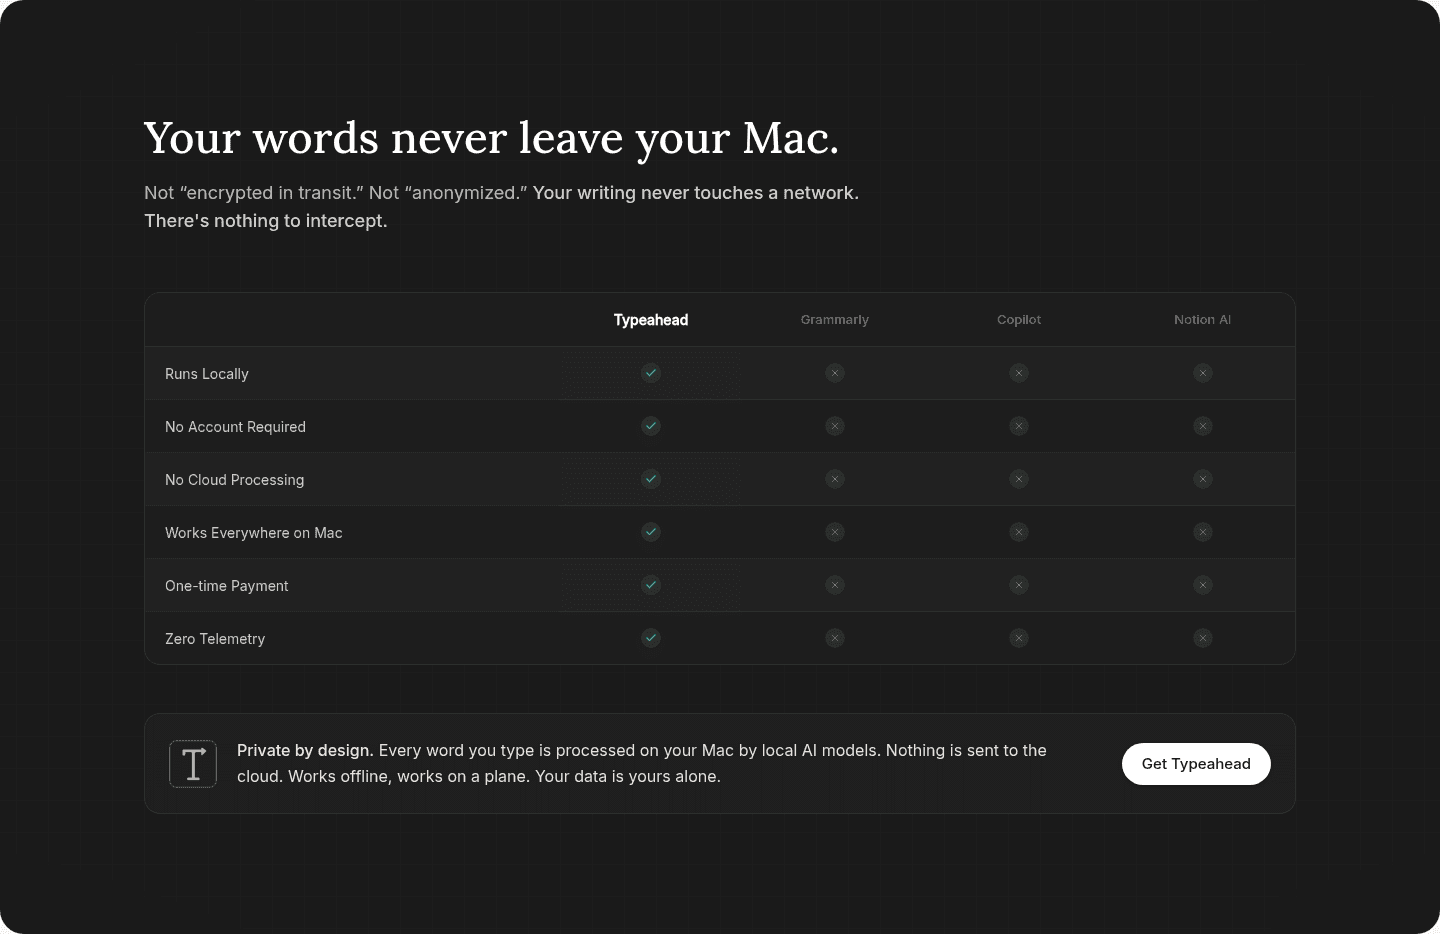
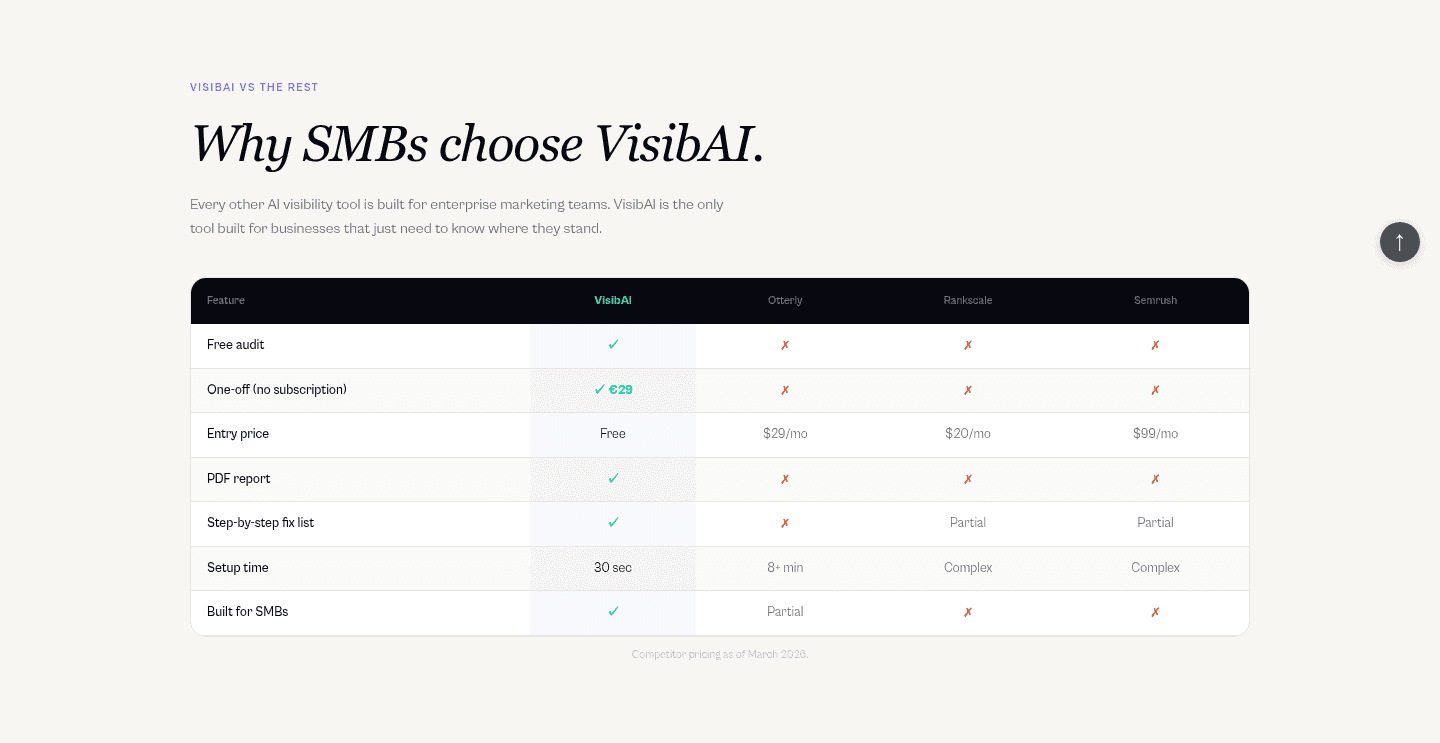
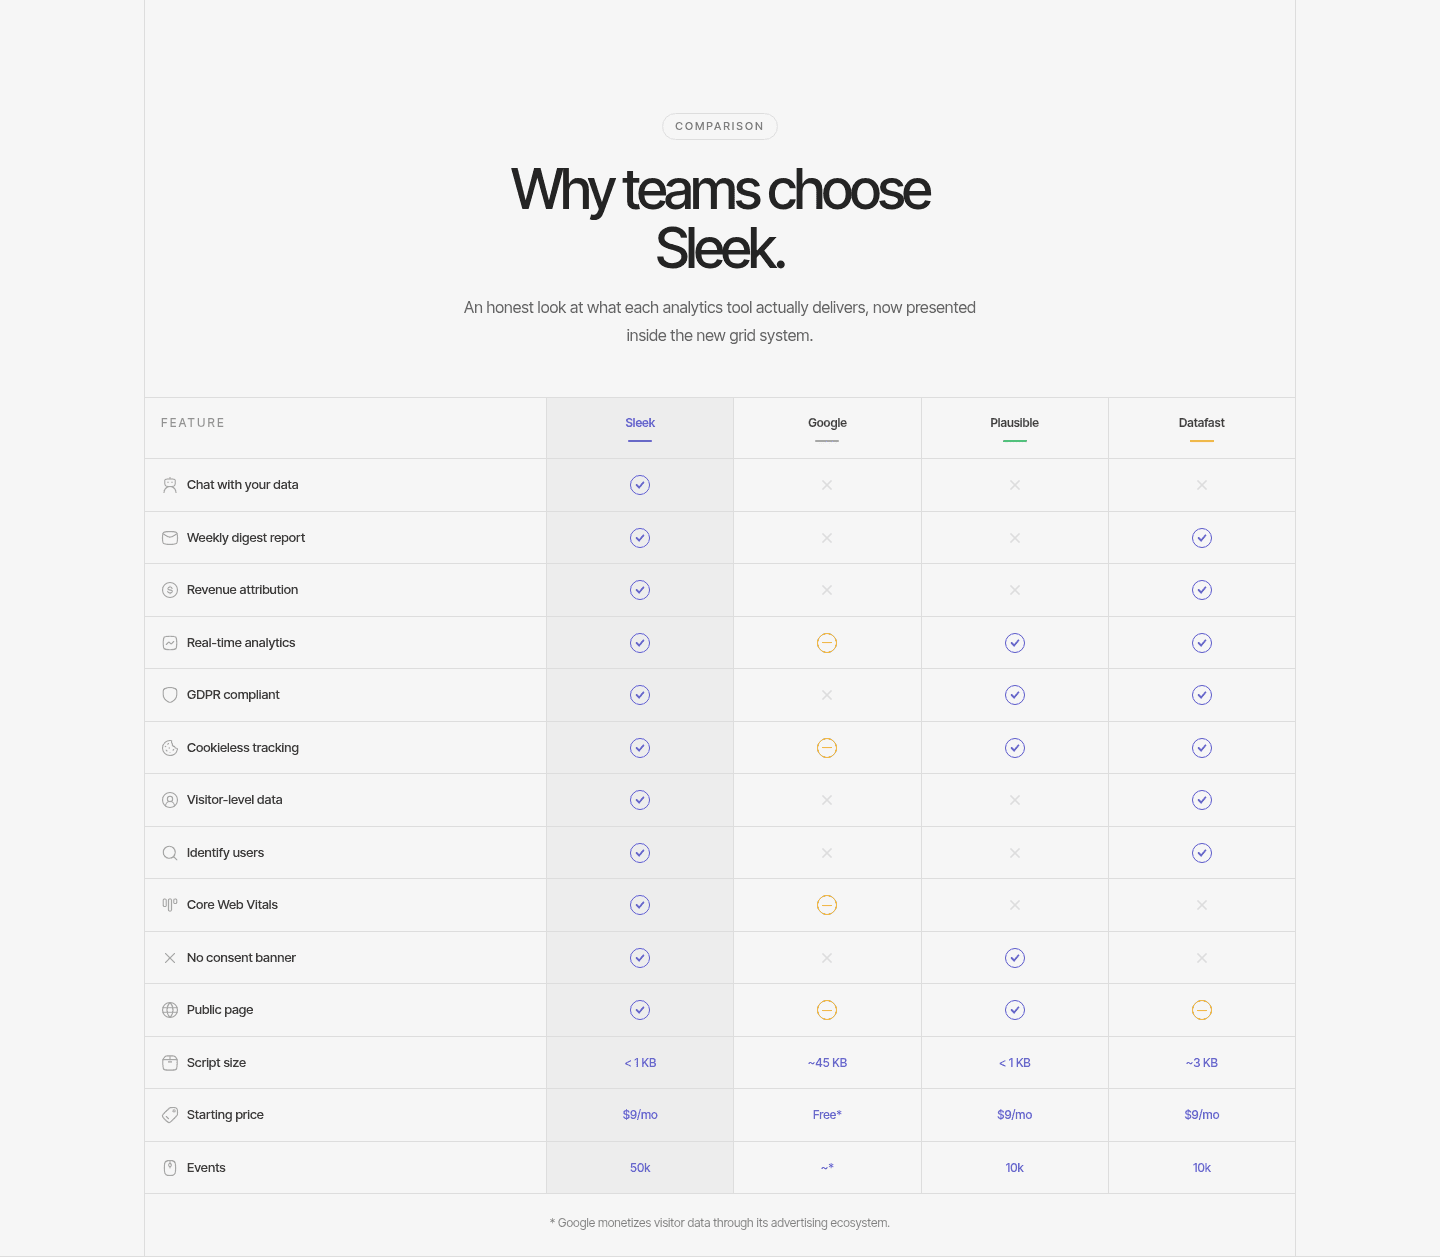
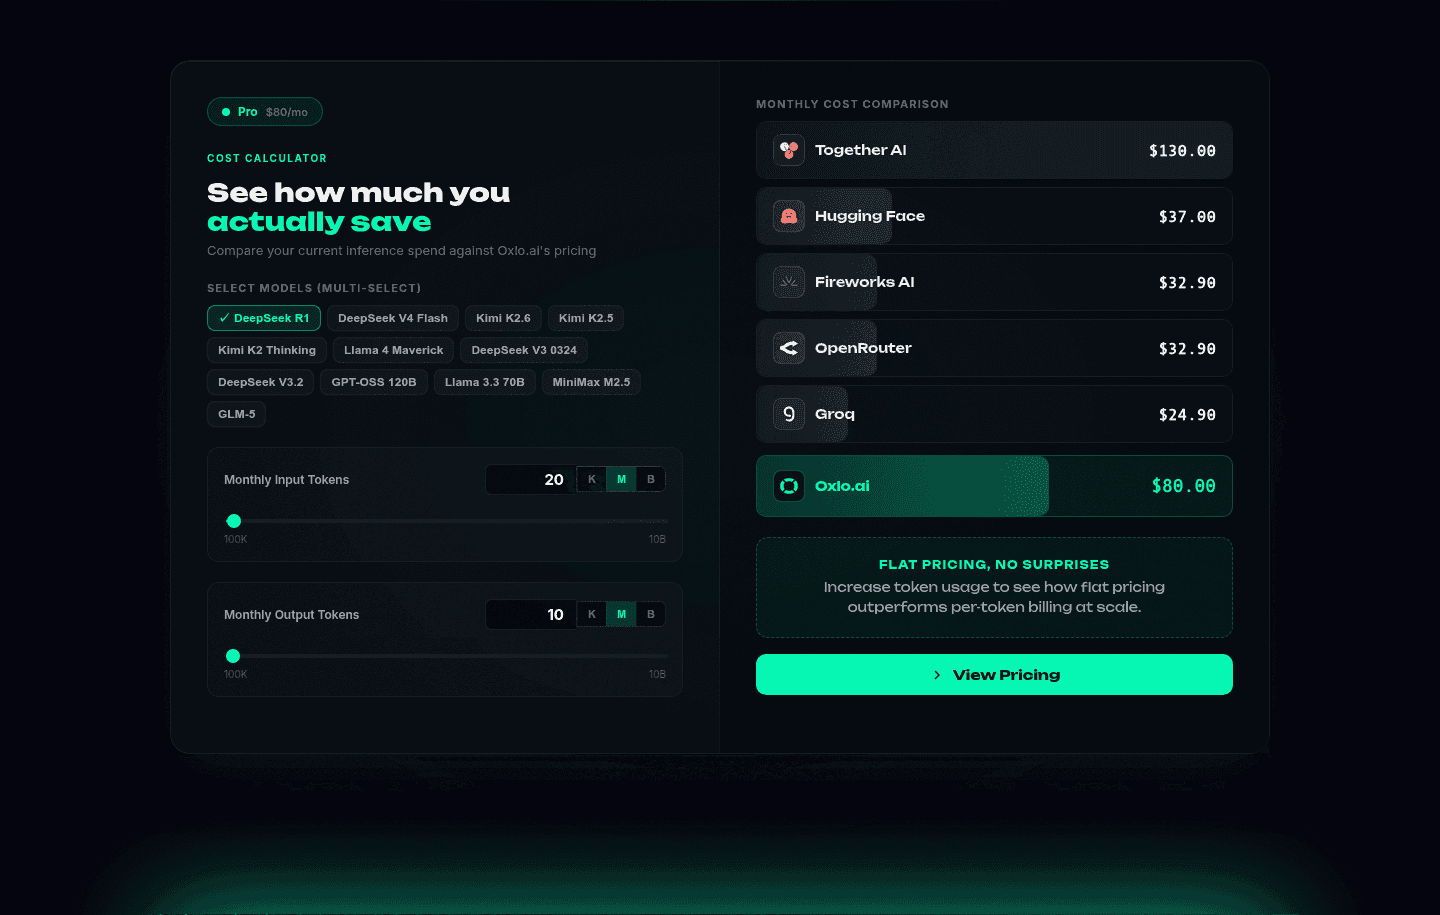

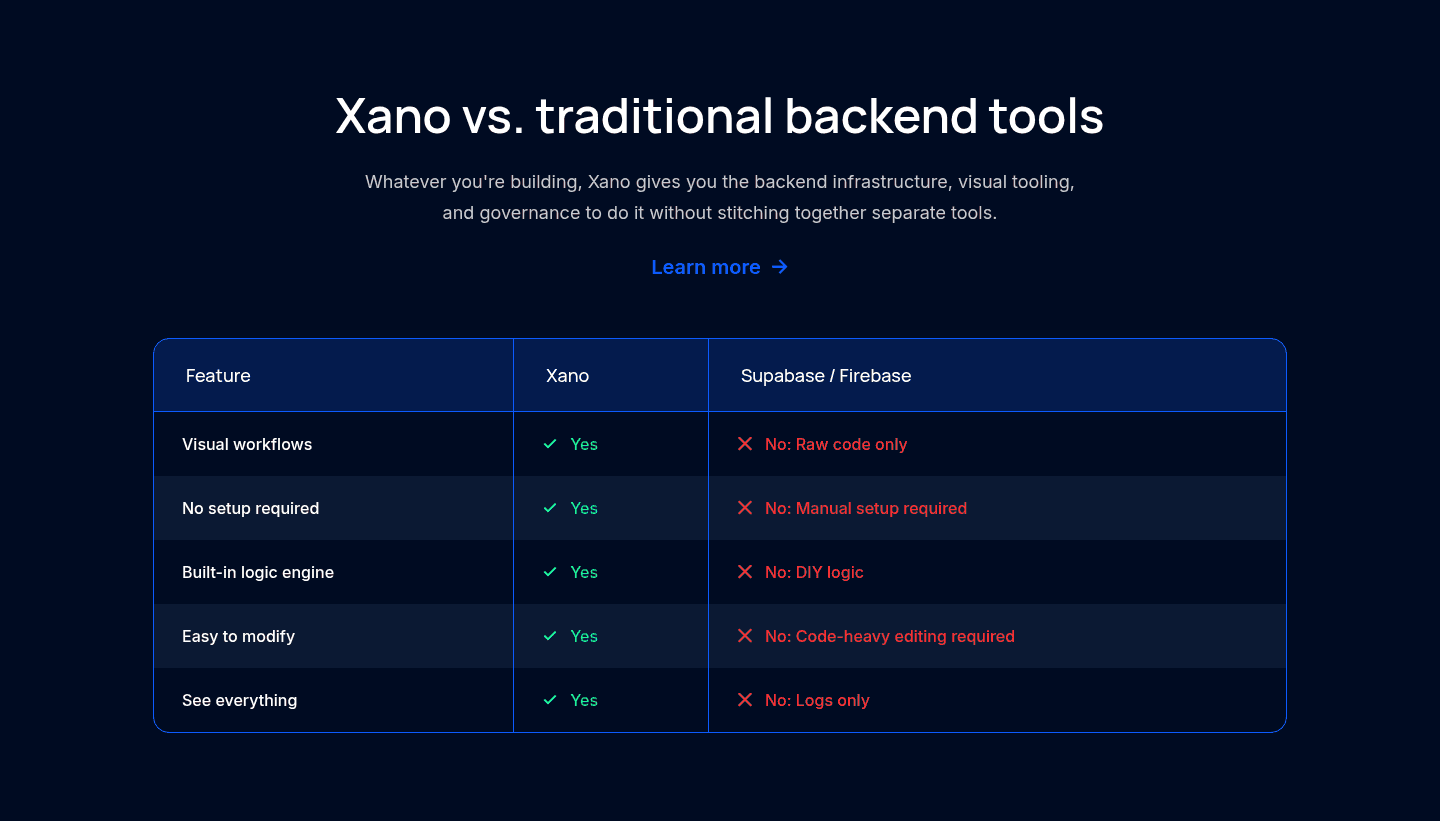
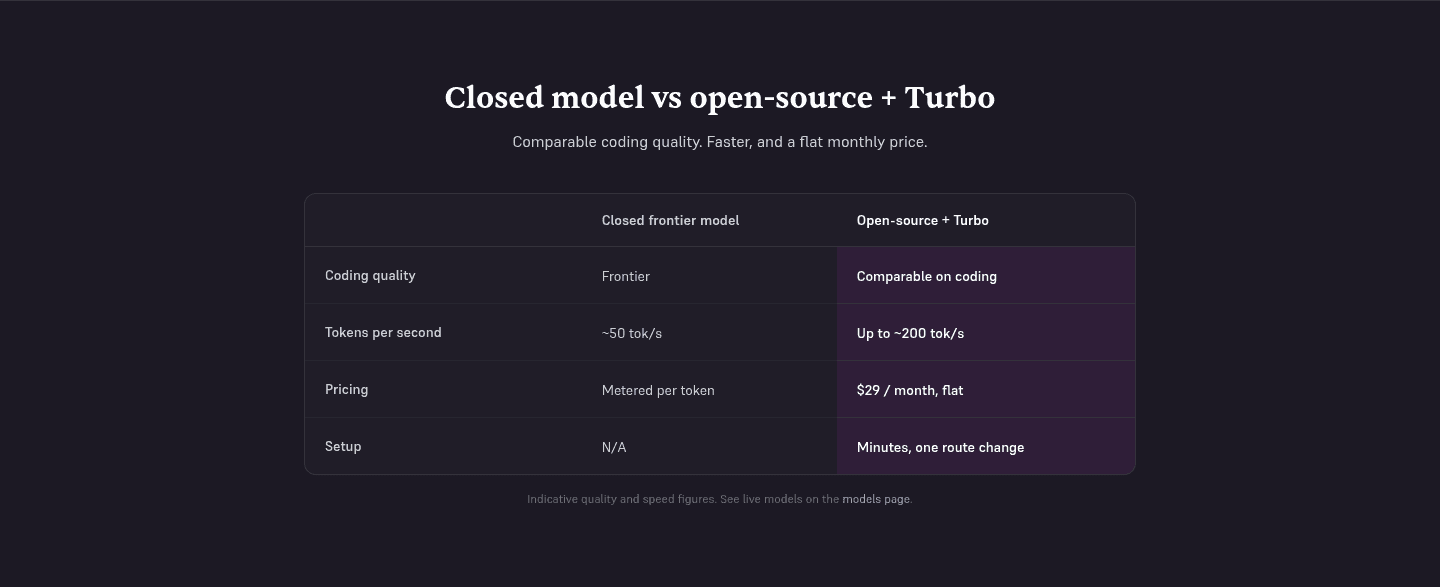

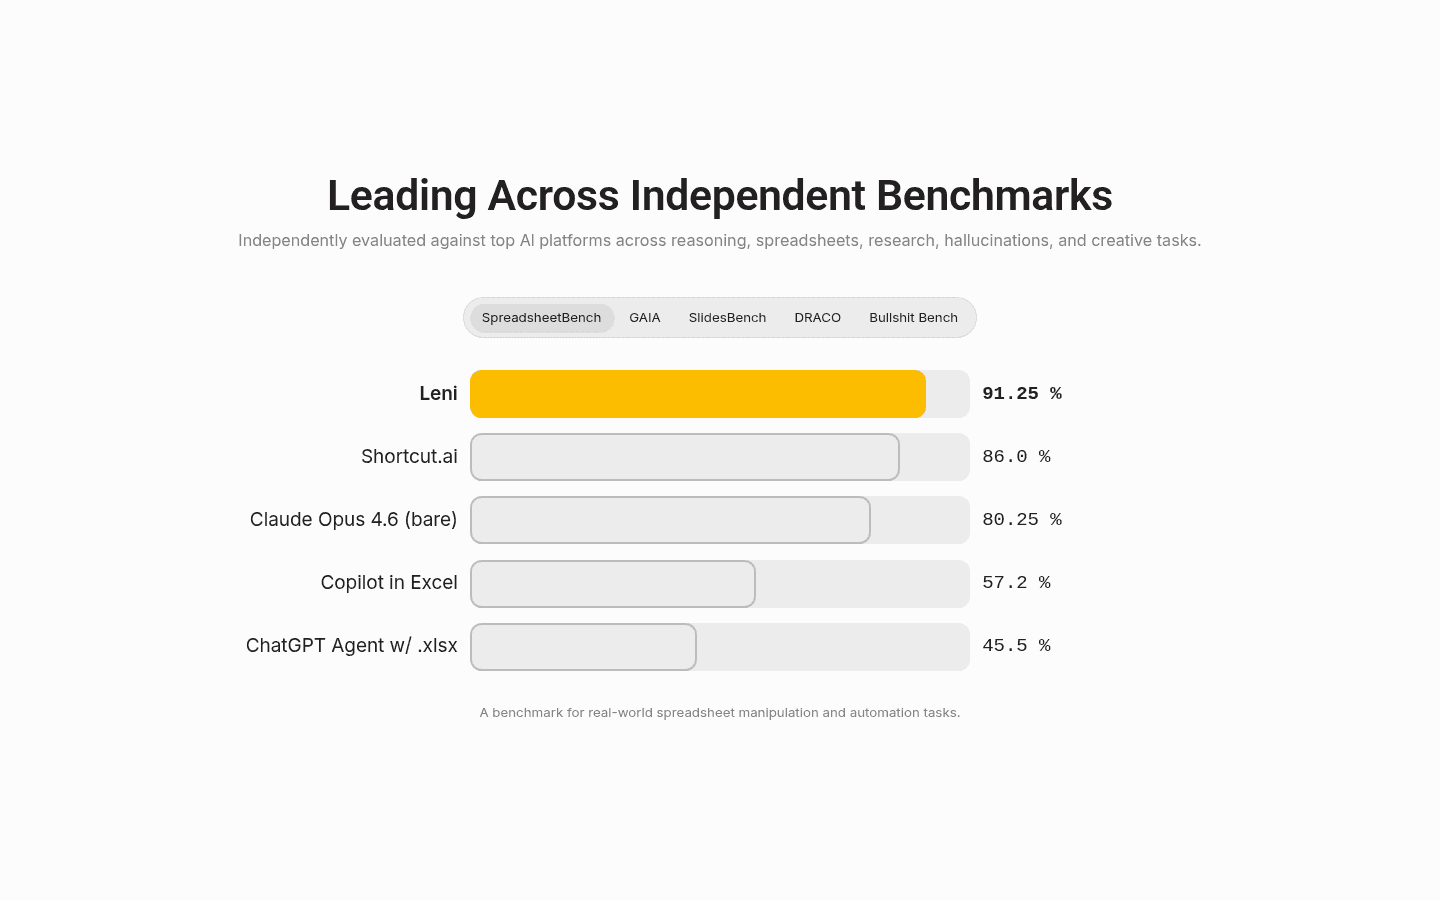
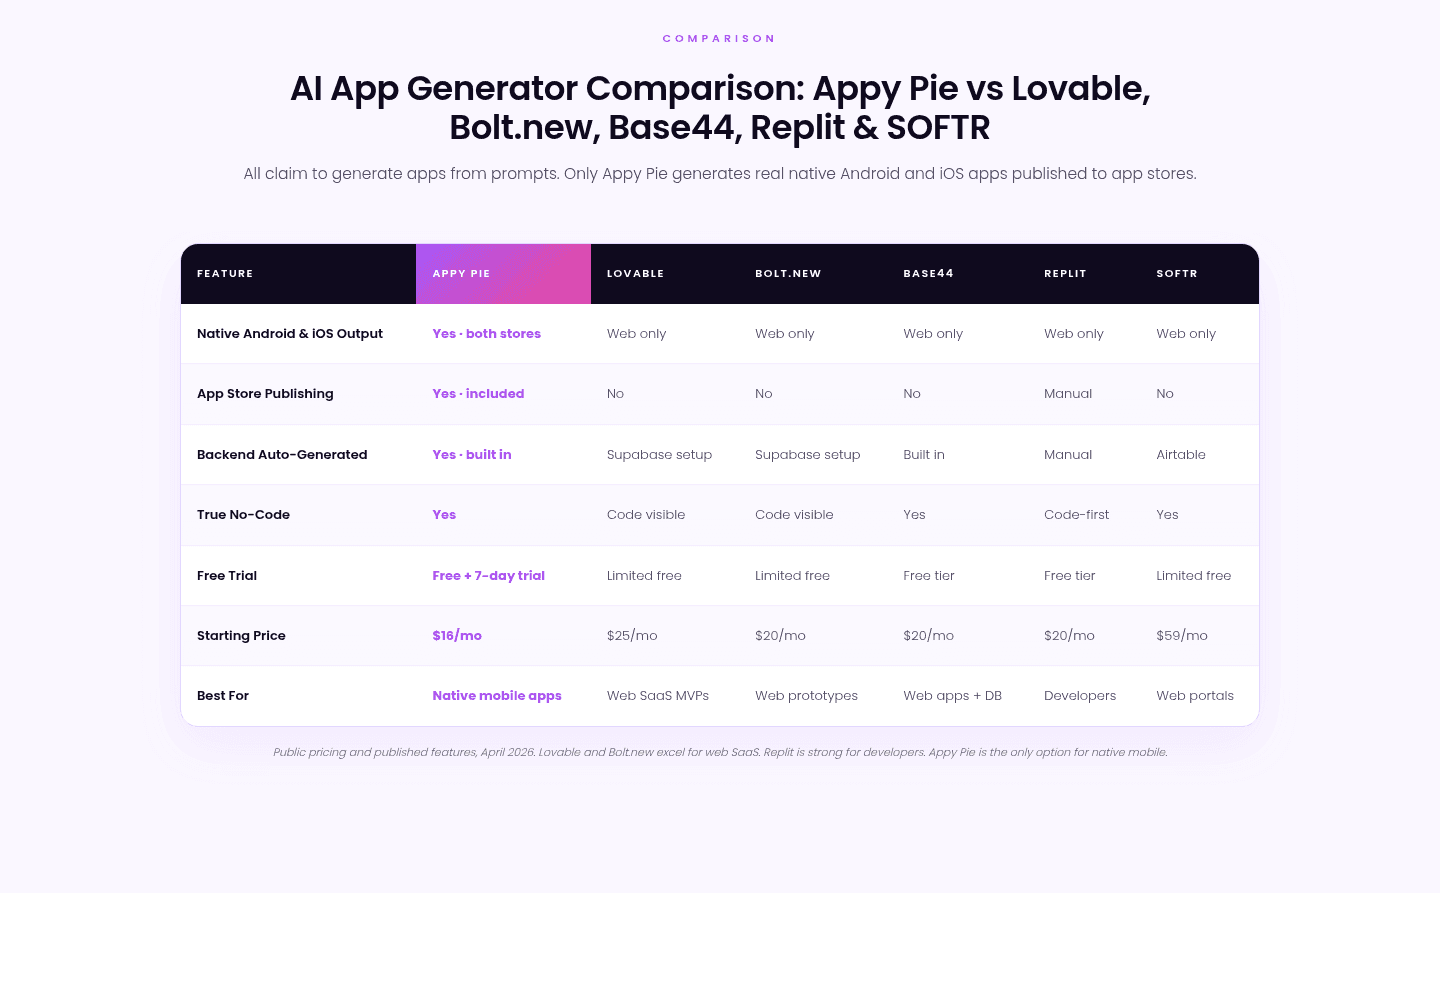


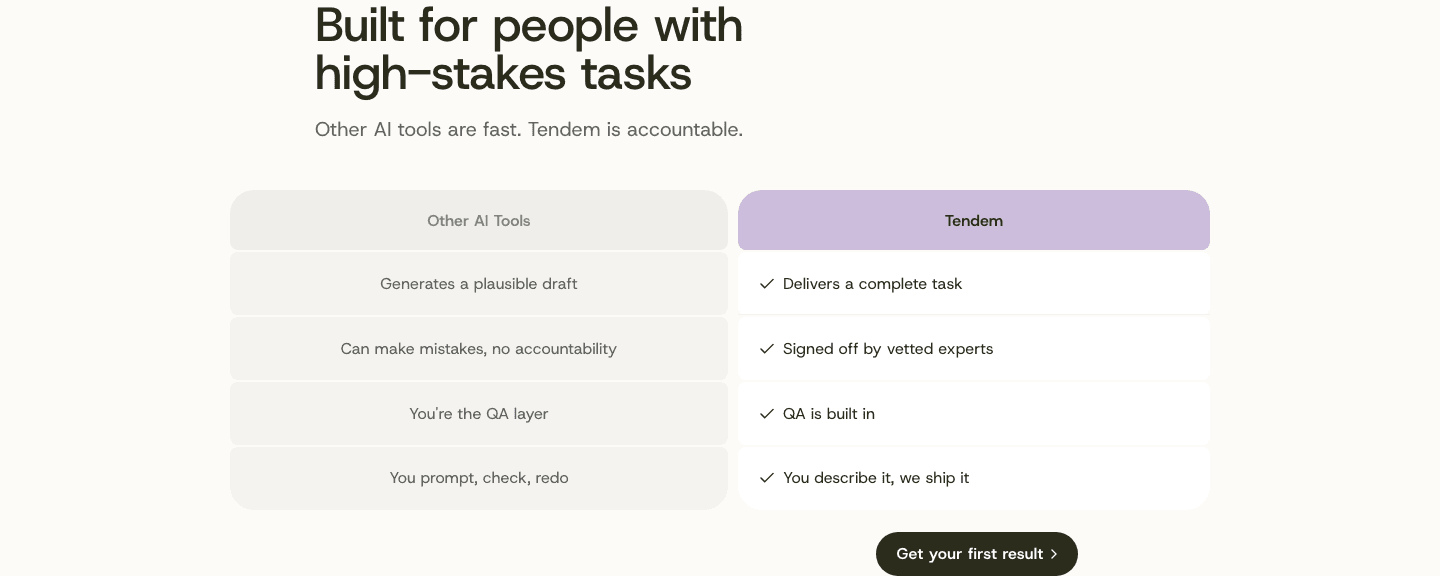

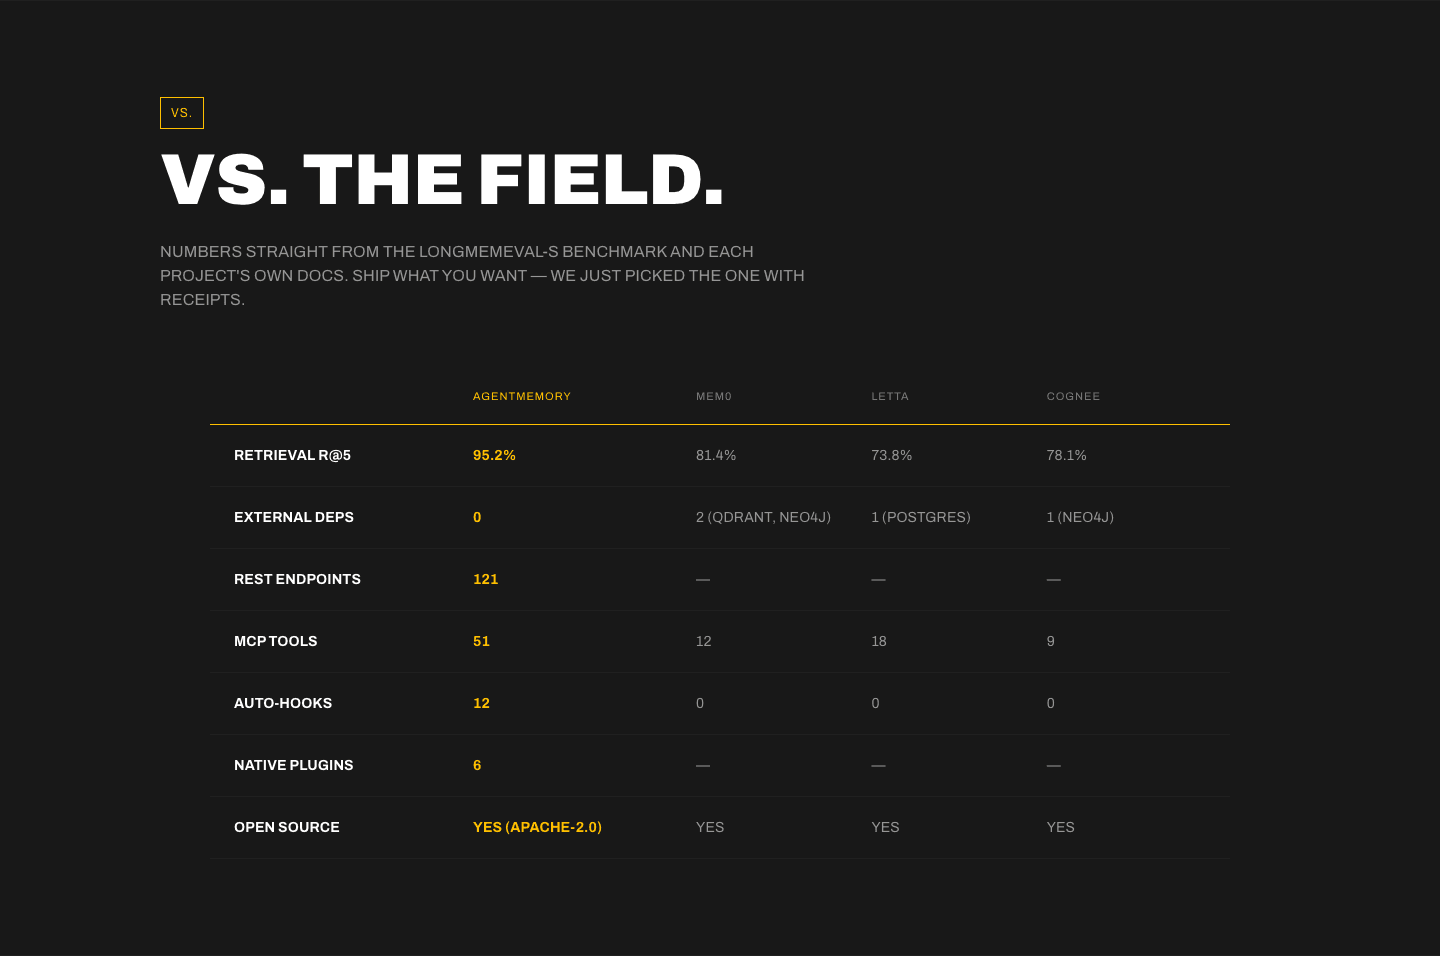
A comparison section is the block, usually a comparison table, that puts your product next to the alternatives a buyer is weighing: rows for features, a column per product. It saves the visitor from opening five tabs to compare for themselves.
What the best comparison sections do:
Put it where the buyer is choosing: on the homepage below the features, or on a dedicated "vs" page.
We checked the comparison sections in our library for the elements below. The lower the number, the fewer pages do it, and the bigger your edge when you add it.
Three or more competitors side by side. One-on-one tables feel incomplete
Shows where you lose or tie, not only where you win. "Partial" or "No" entries that build credibility
"Why us" framing baked into the table structure, not buried in fine print
Clean rows, consistent columns, checkmarks or values that scan in under 10 seconds
| Element | What it means | Use it | Type |
|---|---|---|---|
| Multiple comparisons | Three or more competitors side by side. One-on-one tables feel incomplete | 47% | Opportunity |
| Honest limitations | Shows where you lose or tie, not only where you win. "Partial" or "No" entries that build credibility | 53% | Common |
| Competitive positioning | "Why us" framing baked into the table structure, not buried in fine print | 89% | Table stakes |
| Feature matrix clarity | Clean rows, consistent columns, checkmarks or values that scan in under 10 seconds | 95% | Table stakes |
One gap worth noting: when we scored them, none of the comparison sections put a button inside the table, the place where the visitor has just been convinced.
We check every comparison section against a weighted checklist, from the page itself and its screenshot:
Honest limitations and several rivals weigh the most, because the highest-scoring comparison sections lean on them. Sections flagged best-in-class are picked by hand from the highest scores.
Interactive quiz
Can a visitor scan your comparison table in under 10 seconds?
Clean rows, consistent columns, checkmarks or values that scan quickly
2 comparison sections in our library are flagged best-in-class. They do four things together:
 100/100
The weakest comparison sections stop at a clean table and a "why us" headline. 47% never admit a single weakness: every cell says "Yes" for the product, so the visitor discounts the whole table. And more than half compare against a single rival, which makes the visitor wonder why that one.
The fix is not a redesign. Add a few "No" or "Partial" cells where you genuinely lose, and at least two more competitor columns.
Want to know which best practices your comparison section is missing? Get your 3 free opportunities →
 10/100
Comparison tables with a dated source line or a named benchmark, so a buyer can verify every cell instead of taking the winning column on trust.

Curated by
Gabriel Amzallag , Founder, Web Anatomy
5 years CRO + SEO at Qonto (2021–2025). After advising 15+ SaaS on their websites (Payfit, Pigment…), the same patterns kept breaking, so I decided to build the source of truth on what works on the web: the intelligence layer every tool, builder, and team uses to ship sites that perform.
Real examples from landing pages, SaaS products, ecommerce and digital products, scored and analyzed.
Everything you need to know about comparison section design, based on our analysis of real landing pages across 40+ industries.
A comparison section needs enough rows to cover the features that matter to your buyer, typically 8-15 rows. More than 20 rows overwhelms. In our database, 95% of 45 comparison sections use a structured matrix format. Keep columns to 3-5 products max. On mobile, make the table horizontally scrollable or switch to stacked cards.
A pricing table shows your own plans side by side (Starter vs Pro vs Enterprise). A comparison section shows your product against competitors. The intent is different: pricing tables help visitors pick a tier, comparison sections help them pick a vendor. In our library, 89% of comparison sections frame the "why us" angle with competitive positioning.
If your visitors are actively evaluating alternatives, yes. SaaS buyers typically compare 3-4 tools before deciding. A comparison section on your site controls the framing. Without one, your prospects are comparing you on G2 or Reddit, where you do not control the narrative. 47% of comparison sections in our database compare against 3+ competitors.
Yes, but less than most teams assume. Naming a competitor in a comparison table is legal in almost every market as long as the claims are accurate, current, and fair. Two practical rules keep you safe. First, cite a source for every specific claim: their pricing page, their docs, their changelog. Screenshot it and keep it filed. Second, never misrepresent: if a competitor launched a feature last month, update the table. Avoid trademarked logos unless you're in a clean nominative-use context. When in doubt, run the table past a lawyer. One review covers every comparison page you ship.
Checkmarks scan faster. Feature descriptions explain better. The best approach: checkmarks for binary features (yes/no), short values for quantitative features ("Unlimited" vs "Up to 10"). 95% of comparison sections in our library use a clean feature matrix with scannable entries. Avoid paragraph text inside table cells.
Check that it names a real competitor and that the feature matrix is easy to read. Then look for an honest limitation, more than one comparison, and a CTA inside the table. Or get your 3 free opportunities, ranked with the evidence behind each.
Showing 1–29 of 45 examples