What high-performing analytics website design gets right
Analytics pages have to translate complexity into clarity while proving they can deliver the insights buyers already expect. The strongest pages in this benchmark do four jobs early:
50.6/100
Avg. page score
Make the analytics category obvious in the first viewport so the buyer knows what data problem the product solves.
Layer proof into the page before the ask, using review scores, customer counts, compliance badges, or real dashboard screenshots.
Show the product as a real workflow or dashboard so the promise feels operational instead of abstract.
Give evaluators a low-friction next step with dual CTAs and supportive risk-reducing microcopy like free plans or no-credit-card promises.
6 best analytics homepages analyzed in detail
Each company below is paired with its strongest section and scored across 60+ conversion criteria. See what they get right, and what you can borrow.
01
Veltrix AI
Editor's pick75/100
What makes this page stand out
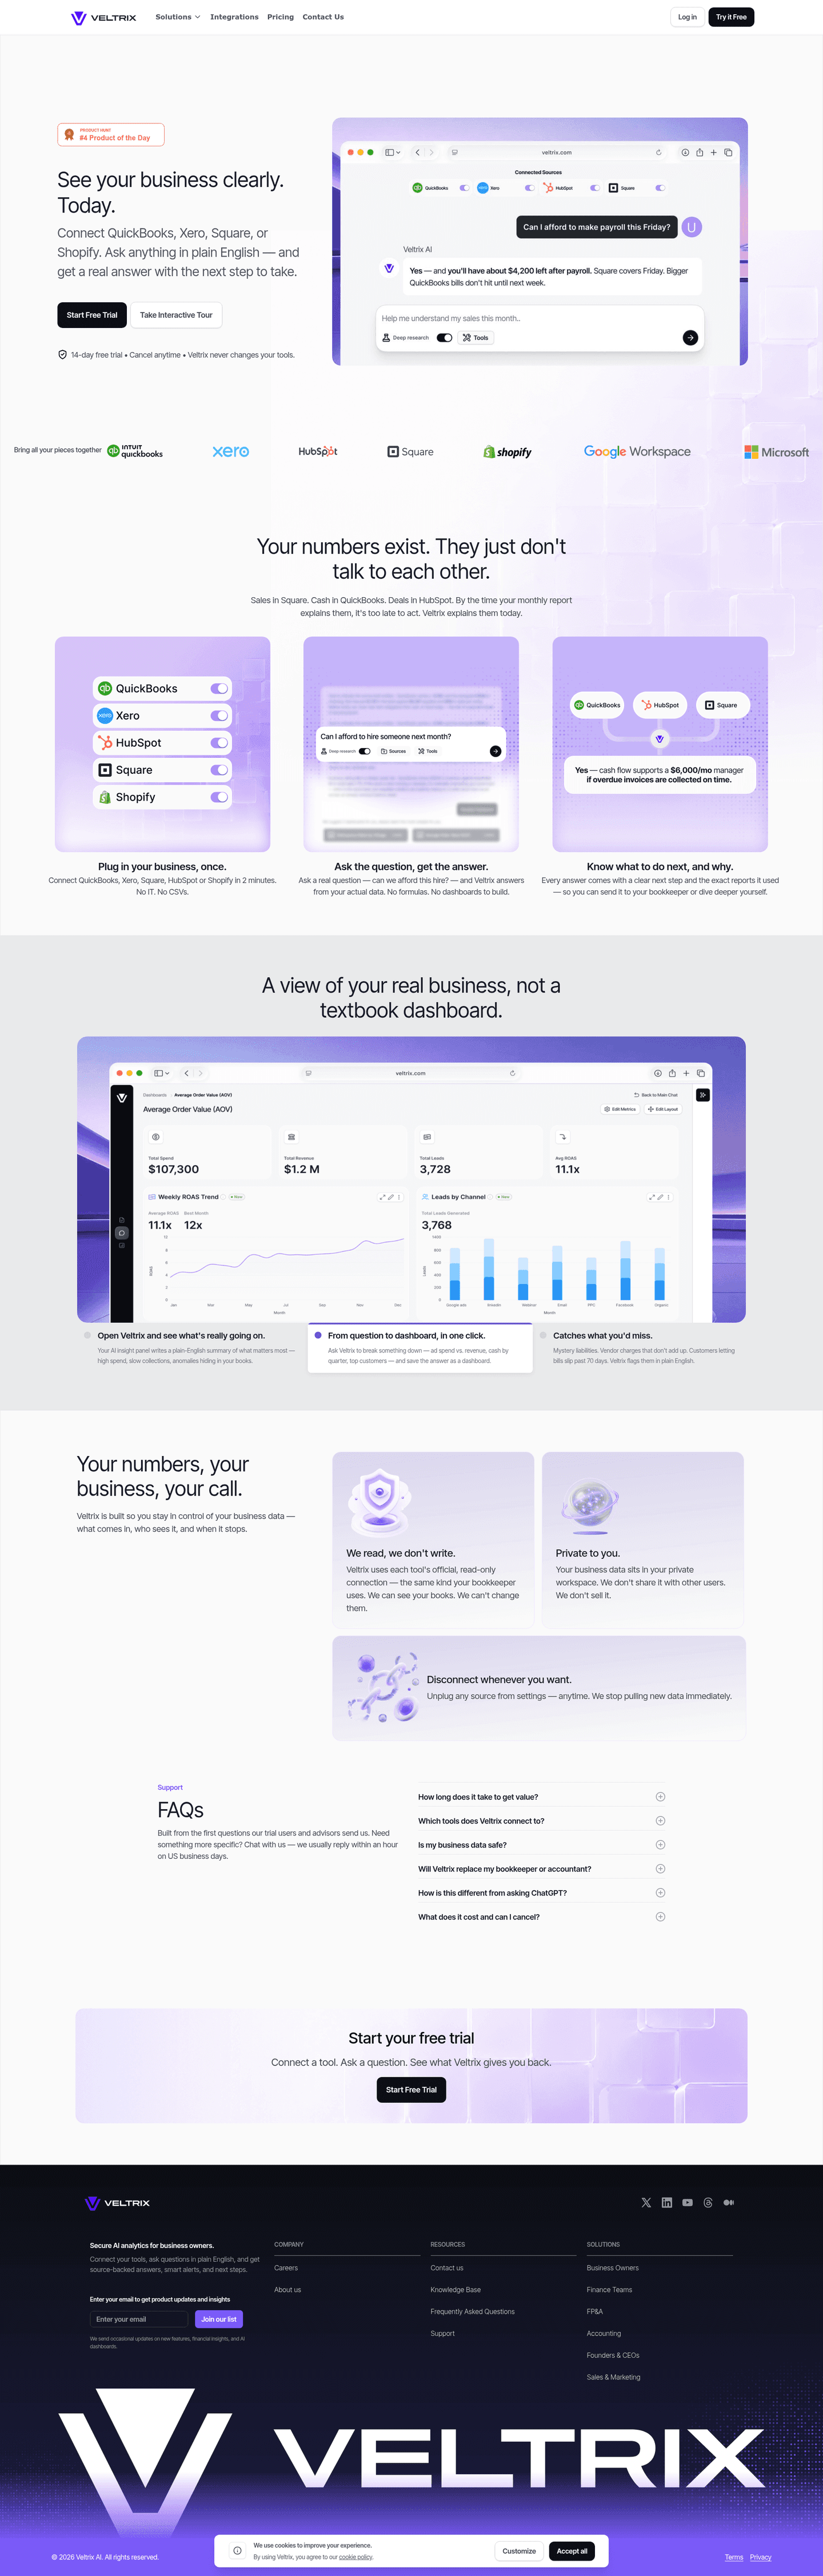
The hero uses two CTAs—“Start Free Trial” and “Take Interactive Tour”—to capture both high- and low-intent visitors.
The risk-reversal line “14-day free trial • Cancel anytime • Veltrix never changes your tools.” reinforces safety beside a shield icon.
The integrations row spotlights recognizable logos like QuickBooks, Xero, HubSpot, Square, and Shopify to validate compatibility fast.
The security section headlines “We read, we don't write.” plus “Private to you.” and “Disconnect whenever you want.” to reduce data anxiety.
Section we love
·Hero
1Action-led primary CTA (Start Free Trial) paired with a low-commitment secondary path (Take Interactive Tour)
2Risk reducer under the buttons (14-day free trial, Cancel anytime, Veltrix never changes your tools) kills switching fear
3Real chat UI answers a high-stakes question (Can I afford to make payroll this Friday?) showing the product in action
4Integration logo bar (QuickBooks, Xero, Square, Shopify, Google Workspace, Microsoft) and PH badge add proof above the fold
02
Rampmetrics, Marketing attribution with persona-driven navigation.
5 years CRO + SEO at Qonto (2021–2025). After advising 15+ SaaS on their websites (Payfit, Pigment…), the same patterns kept breaking, so I decided to build the source of truth on what works on the web: the intelligence layer every tool, builder, and team uses to ship sites that perform.
“Rampmetrics builds a top-scoring navbar with a solutions mega menu that segments by feature and persona, covering five roles from CMOs to Marketing Ops. The green Book Demo CTA provides a clear action, while the partner tab and login utility nav add routing depth for different visitor intents.”
What makes this page stand out
The detailed breakdown of homegrown attribution weaknesses (data gaps, cross-channel blind spots, maintenance burden, stale models) validates the buyer's existing frustration with specific evidence
Clear differentiation through automated multi-touch attribution eliminates the manual data wrangling that makes homegrown solutions unsustainable as marketing channels multiply
The "single source of truth" promise addresses the organizational pain of marketing and sales teams arguing over which channels actually drive revenue
Real-time attribution visibility transforms marketing from a monthly reporting exercise into a continuous optimization loop — enabling faster budget reallocation decisions
Section we love
·Navbar
1The dark open Solutions menu lays out features in a clean multi-column grid
5 years CRO + SEO at Qonto (2021–2025). After advising 15+ SaaS on their websites (Payfit, Pigment…), the same patterns kept breaking, so I decided to build the source of truth on what works on the web: the intelligence layer every tool, builder, and team uses to ship sites that perform.
“Whatagraph leads with dual CTAs and a product workflow diagram that visualizes how data moves from connection through organization to sharing. Integration icons for Google Ads, Facebook, and others make the platform feel immediately familiar, while the 1,000+ marketing teams claim anchors social proof early.”
What makes this page stand out
The value proposition flow (connects, cleans, delivers instant insights — all in one place) addresses the three biggest pain points in marketing reporting: data fragmentation, data quality, and time to insight
Social proof is agency-focused and ROI-driven: 1,000+ agencies and brands, with case studies showing 100 hours saved/month, 65% cost savings, and 63 hours/month saved — all quantified time/money metrics
The "AI workflow" positioning shows modern market awareness, but the core promise remains simplicity and ease of use — a smart balance between innovation and accessibility
"Designed for marketers, not data teams" is an implicit competitive positioning against tools like Looker, Tableau, or Power BI that require technical expertise
Section we love
·Hero
1Dual CTAs (Learn more and Get a personal walkthrough) let visitors self-serve or get guided tour
2Social proof (1000+ marketing teams) with specific benefit (saves you dozens of hours) in body text
3Product workflow diagram (Connect, Organize, Share, Visualize) shows the full data pipeline at a glance
4Clear product category (fast and easy-to-use marketing data platform) stated in bold subtext
5 years CRO + SEO at Qonto (2021–2025). After advising 15+ SaaS on their websites (Payfit, Pigment…), the same patterns kept breaking, so I decided to build the source of truth on what works on the web: the intelligence layer every tool, builder, and team uses to ship sites that perform.
“Herdify earns a top-scoring how-it-works score with a zigzag layout and custom illustrations that make word-of-mouth analytics tangible. The closed-loop feedback step and proactive GDPR compliance messaging build trust in a category where buyers need extra reassurance about data handling.”
What makes this page stand out
Unique behavioral science foundation: model originally built to track virus spread, now applied to word-of-mouth mapping
Exceptional case study metrics: 168% boost in response rates (Abel & Cole), 23% increase in donations (RSPCA), 3.4x new customer penetration (Who Gives A Crap)
Clear 4-step process (Map customers → Analyze word-of-mouth → Target best areas → Measure results) makes the methodology tangible
Section we love
·Footer
1Links grouped into 3 labeled columns (Contact, Sitemap, Information) for clear navigation
2Cyber Essentials Certified security badge stands out in the footer to reinforce trust
3Sign up to the Herdify newsletter link captures non-buyers as a secondary conversion
4Legal links (Privacy policy, Cookies, Terms and conditions) are listed under a clear heading
05
Tresl
68/100
What makes this page stand out
Top navigation shows “Log in” and a “Try for free” CTA before any scrolling.
The CTAs “Try Segments for free on Shopify” and “Schedule demo” are reinforced by “14-day free trial • Cancel anytime”.
The dashboard mock shows “Estimated email revenue $635,305” alongside Klaviyo, Meta, Google, and Shopify targeting options.
Trust signals include “Trusted by 1,000+ happy customers” plus 2K+ installations, $5B+ GMV analyzed, 100M+ orders parsed.
Section we love
·Cta
1Action-oriented primary CTA (Try Segments for free on Shopify) names the action and the platform in one line
2Reassuring microcopy (14-day free trial, Cancel anytime) sits right under the button to kill signup hesitation
3Real dashboard preview (Customers 153,503, AOV $160.8, purchase-timing chart) shows the exact insights buyers get
4Secondary path (Schedule demo) next to the primary CTA captures visitors who want a guided look first
06
Attribuly, Shopify attribution with quantified growth levers.
5 years CRO + SEO at Qonto (2021–2025). After advising 15+ SaaS on their websites (Payfit, Pigment…), the same patterns kept breaking, so I decided to build the source of truth on what works on the web: the intelligence layer every tool, builder, and team uses to ship sites that perform.
“Attribuly anchors its value proposition around four growth levers, each backed by quantified outcomes like 2x retargeting lift. Visual charts and funnel diagrams make every claim verifiable, and Learn More links on each card create natural paths for deeper evaluation within a Shopify-specific framing.”
What makes this page stand out
The differentiation is sharp: while Shopify's built-in analytics and Google Analytics offer last-click attribution, Attribuly provides first-party, multi-touch attribution that survives iOS privacy changes and cookie restrictions
Social proof placed in context — specific Shopify store revenue increases attributed to better attribution decisions — backs up the claims with merchant-relatable outcomes
The Shopify-native positioning (built as a Shopify app, not adapted from a generic platform) means seamless installation and immediate data flow without complex integration work
Server-side tracking capability addresses the technical reality that browser-based tracking is increasingly unreliable due to ad blockers, ITP, and privacy regulations
Section we love
·Value PropositionBest in class
1Four growth levers as separate cards, each headline carrying a number: retarget 2x, attribute 99%, grow email list 10x, richer analytics
2Every card has a custom data visual (50 to 90% donuts, channel journey graph, bar charts, funnel) that shows the lift, not decoration
3Mechanism is named, not vague: unifies Shopify, Meta, Google, Klaviyo and pushes server-side data into GA4, Looker Studio, BigQuery
4A Learn More link sits under every card so high-intent merchants can dig into a single lever
See how your page compares to the 50.6 average page score
Run a diagnostic on your analytics page and get a section-by-section breakdown of what to fix first to improve clarity, trust, and product proof.
Design patterns we see across high-performing analytics pages
Across 69 analytics pages reviewed, the pages that convert tend to make the first screen do one job: state a clear promise and remove obvious doubt.
The strongest patterns pair action-oriented copy with strong visual hierarchy, then back those claims with proof that feels easy to verify for a first-time visitor, especially important in analytics website design where buyers need to trust the data before they trust the product. Use website section examples to compare how these building blocks show up across page types.
1Benefit-led headers (Your AI data analyst on demand, Insights turned into automated actions) put outcomes before features
2Pain-to-outcome framing up top (No dashboards to build, No SQL to write, No pipelines or cleanup work) sells the relief
3Two embedded demo videos with play buttons show the AI cleaning a CSV and building a metrics table live
4Outcome visualization (a real metrics table with an Add this table to Databox button) shows the concrete result
5Supporting feature bullets per block (Pull data from an API, Trigger smart alerts, Auto executive summaries) add depth
Reviewed design-pattern pick from Databox MCP’s features section.
What I love about this section
Benefit-led headers (Your AI data analyst on demand, Insights turned into automated actions) put outcomes before features
Pain-to-outcome framing up top (No dashboards to build, No SQL to write, No pipelines or cleanup work) sells the relief
Two embedded demo videos with play buttons show the AI cleaning a CSV and building a metrics table live
Outcome visualization (a real metrics table with an Add this table to Databox button) shows the concrete result
Overlooked sections that quietly drive clarity and trust
In this set, navigation and persona-routing sections often do more conversion work than teams expect: they shape product understanding, reduce decision friction, and help different buyer types self-qualify before they reach the hero.
The biggest gaps usually appear where the page should explain use cases and team fit in plain language. When those sections are thin, the hero gets forced to do all the positioning work, and visitors with niche analytics needs are left guessing about relevance.
1Four team tabs (Product, Marketing, Data, Engineering) each carry their own outcome line (Fuel faster growth, Build customers for life, Unlock trusted data, Ship faster)
2The active Product teams tab shows a scenario (trusted insights about user engagement to build better products)
3A role-matched testimonial from Damien Delautier (Chief Product Officer, Groupe Canal+) backs the product persona
4The black active-tab state makes the current selection and switching obvious
5Each persona gets a distinct promise rather than one generic benefit reused across teams
Reviewed overlooked-section pick from Amplitude’s use cases section.
What I love about this section
Four team tabs (Product, Marketing, Data, Engineering) each carry their own outcome line (Fuel faster growth, Build customers for life, Unlock trusted data, Ship faster)
The active Product teams tab shows a scenario (trusted insights about user engagement to build better products)
A role-matched testimonial from Damien Delautier (Chief Product Officer, Groupe Canal+) backs the product persona
The black active-tab state makes the current selection and switching obvious
Use the examples below as prompts for what to standardize, not just what to redesign.
Checklist: a practical audit for analytics website design
If you are iterating on an analytics homepage design, this checklist helps you spot missing sections and messaging gaps quickly, especially around Value Proposition, Cta, and Hero.
Run it on your current page, then decide what to rewrite, what to reorder, and what proof to add before you touch visual polish. For a faster baseline, you can also try our landing page audit.
Built from 195 sections across 45 analytics homepages in this benchmark. Each check below is a move the highest-scoring pages share, each paired with a real example from the benchmark.
Hero
Can a skeptical buyer tell what you do in five seconds?
The hero makes it instantly clear what the product is and who it's for.
Example: Optise calls out the buyer directly, "You are a B2B marketer, not a full-time website expert," so the fit lands instantly.
The real product shows above the fold.
Example: ComboCurve pairs a "10x Faster" headline with a live product screenshot instead of a hero graphic.
Proof is visible before the first scroll.
Example: Databox surfaces double review scores, G2 4.4 and Capterra 4.6 on 1,000+ reviews, in the first screen.
Trust
Does the page earn belief before it asks for anything?
A recognizable logo wall signals who already relies on the product.
Example: Alteryx lines up Siemens Energy, Bank of America, Coca-Cola, 7-Eleven, and BT to borrow trust from household enterprises.
The proof carries a hard number.
Example: Databox headlines "Trusted by 20,000+ teams" and pairs the number with a sharp positioning line.
Animated or counted stats make the scale feel concrete.
Example: Determ leads with concrete, outcome-led stats, "84x faster crisis reaction" and "20h saved per week."
Value proposition
Is the value concrete, or just adjectives?
Benefits are specific.
Example: Ahrefs runs three concrete benefit cards, API access, AI chatbot connection, and custom reports, each with its own proof point.
The unique mechanism is named.
Example: DinMo frames the payoff sharply, "up and running in a day, not a year," with connection in 30 minutes or less.
The promise is quantified with a number.
Example: Attribuly stacks four growth levers as cards, each headline carrying a number, "retarget 2x," "attribute 99%," "grow email list 10x."
Features
Do features connect to outcomes the buyer cares about?
Feature copy leads with the outcome.
Example: Surfer SEO headlines outcomes, "Generate ready to rank article in minutes," not the underlying feature name.
The outcome is visualized.
Example: DevStats frames the payoff, "Find where work gets stuck, cut your time to production," with the workflow in view.
Each feature maps a real pain to a measurable result.
Example: Supaboard targets the pain in one line, "Built for teams that move fast," before naming the capability.
Call to action
Does the next click feel safe to a cautious buyer?
One primary action dominates, with action-led copy.
Example: SEMrush lets a single orange "Try for free" button stand out against the block with no competing action.
The block stays single-focus instead of splitting attention.
Example: Vesper gives one dominant button, "Explore Vesper now," with no competing links.
A clear secondary path catches the not-yet-ready buyer.
Example: Polymer anchors a dark "Sign up for free" button and keeps a lighter "Contact us" as the second route.
The gap most analytics pages leave open is pricing.
Pricing is the rarest section in the analytics set. Of 45 companies benchmarked, only ten expose a pricing block clear enough to score. The ones that do make the cautious buyer's job easy. DevStats lines up three named plans, Starter at $15, Pro at $27 per contributor, and Enterprise, each with a clear who-it-is-for line. Contentsquare adds a free tier so a visitor can compare without booking a call. Pages that bury pricing behind "contact sales" leave the cheapest trust on the table.
Interactive quiz
What would your analytics homepage score?
Question 1 of 5
0%
Can an analytics buyer identify what you do in under 5 seconds?
"Marketing attribution for growth teams" beats "unlock the power of your data."
Reviewed by
Gabriel Amzallag , Founder, Web Anatomy
5 years CRO + SEO at Qonto (2021–2025). After advising 15+ SaaS on their websites (Payfit, Pigment…), the same patterns kept breaking, so I decided to build the source of truth on what works on the web: the intelligence layer every tool, builder, and team uses to ship sites that perform.
Quick answers based on our analytics website benchmark dataset.
What are the best analytics websites?
[01]
The strongest performers in this June 2026 benchmark are Rampmetrics, Whatagraph, Herdify, Attribuly, LogicMonitor, and Databox. Across 69 analytics homepages scored against 60+ criteria, these pages convert by showing a real dashboard or workflow in the first viewport instead of promising abstract "data insights."
What makes analytics websites harder to convert than generic SaaS pages?
[02]
Analytics buyers are methodical evaluators who need to see the output before they trust the pipeline. Across 69 homepages reviewed, the pages that convert make the data visible: LogicMonitor shows a real monitoring dashboard at 99.952% uptime, Whatagraph walks visitors through Connect, Organize, Share, and Visualize stages, and Attribuly anchors attribution claims with a 2x retargeting lift stat on every card.
What is the biggest design mistake on analytics homepages?
[03]
Leading with abstract data promises while delaying proof of what the product actually shows. The average page in this June 2026 benchmark scored 50.6. Top performers answer "what will I see?" in the hero: Databox stacks G2 and Capterra scores with a free-forever plan, Rampmetrics splits the solutions menu across five personas from CMO to Marketing Ops, and Herdify proactively addresses GDPR to disarm data- privacy anxiety.
What sections should an analytics homepage include?
[04]
A hero with one primary action and visible product UI, an early trust layer with review scores or customer logos, a visual how-it-works or workflow section, features tied to measurable outcomes, and a low-friction next step like a free trial or interactive demo. Rampmetrics routes by persona in the nav; Whatagraph makes the data pipeline the hero. Across 69 homepages, these blocks separate top performers from the rest.
How many analytics examples do I need to review before redesigning?
[05]
Three to five is enough if you pick by analytics category and compare section by section. Only 1% of pages in this benchmark score in the top tier, so the gap lives in a few blocks. Study Rampmetrics for persona-driven nav, Whatagraph for workflow-first positioning, LogicMonitor for dashboard-in-hero specificity, Attribuly for quantified growth-lever framing, and Databox for stacked third- party proof.
Where can I find great inspiration for my analytics website?
[06]
Study pages section by section instead of saving full-page screenshots. Browse best landing page examples for the full gallery, then drill into hero section examples and trust section examples to see how Rampmetrics, Whatagraph, and Databox differ at each stage of the funnel.
How do I audit my analytics homepage?
[07]
Use a structured rubric that checks clarity, trust, and friction instead of relying on subjective feedback. Run your page through the landing page analysis for a section-by-section score against the same 60+ criteria used in this benchmark.