What high-performing B2B homepage design gets right
B2B pages have to convince a skeptical buyer that this product is worth evaluating further, usually in under ten seconds. The strongest pages in this benchmark do four jobs early:
52.9/100
Avg. page score
Make the category and audience obvious in the first viewport so the buyer knows whether this product is built for their problem.
Stack trust signals early, logos, review scores, quantified outcomes, or compliance badges, so credibility is established before the ask.
Show the product as a real interface or workflow so the promise feels operational instead of abstract.
Give cautious buyers a low-friction next step with dual CTAs and supportive microcopy that reduces commitment anxiety.
6 best B2B homepages analyzed in detail
Each company below is paired with its strongest section and scored across 60+ conversion criteria. See what they get right, and what you can borrow.
01
ProductLed, PLG methodology with a navigation that sells before the scroll.
5 years CRO + SEO at Qonto (2021–2025). After advising 15+ SaaS on their websites (Payfit, Pigment…), the same patterns kept breaking, so I decided to build the source of truth on what works on the web: the intelligence layer every tool, builder, and team uses to ship sites that perform.
“ProductLed turns navigation into a conversion tool. A Free Tools mega menu surfaces six tools with descriptions, a bold yellow APPLY NOW CTA commands attention, and navigation labels map the buyer journey from learning to implementation. The navbar alone does the work most pages need an entire hero section to accomplish.”
What makes this page stand out
Wes Bush as the instructor brings strong personal brand authority as bestselling author of "Product-Led Growth" and "The Product-Led Playbook" — the definitive books in the PLG space
The 9-week structured program with live sessions and certification creates commitment and completion incentives that typical self-paced courses lack
The $549 price point positions the program as accessible for individual contributors while being easy to expense for team purchases — smart pricing strategy
The PLG Scorecard diagnostic tool gives participants an immediate, personalized assessment — driving engagement before the program even begins
Section we love
·Cta
1One dominant action with an inline email field and Apply Now button removes any extra step to convert
2Urgency framing (The window is closing) plus the line about building it before someone else does pushes immediate sign-up
3Competitive fear angle (Your Competitors Are Already Working On This) gives a sharp reason to act now
02
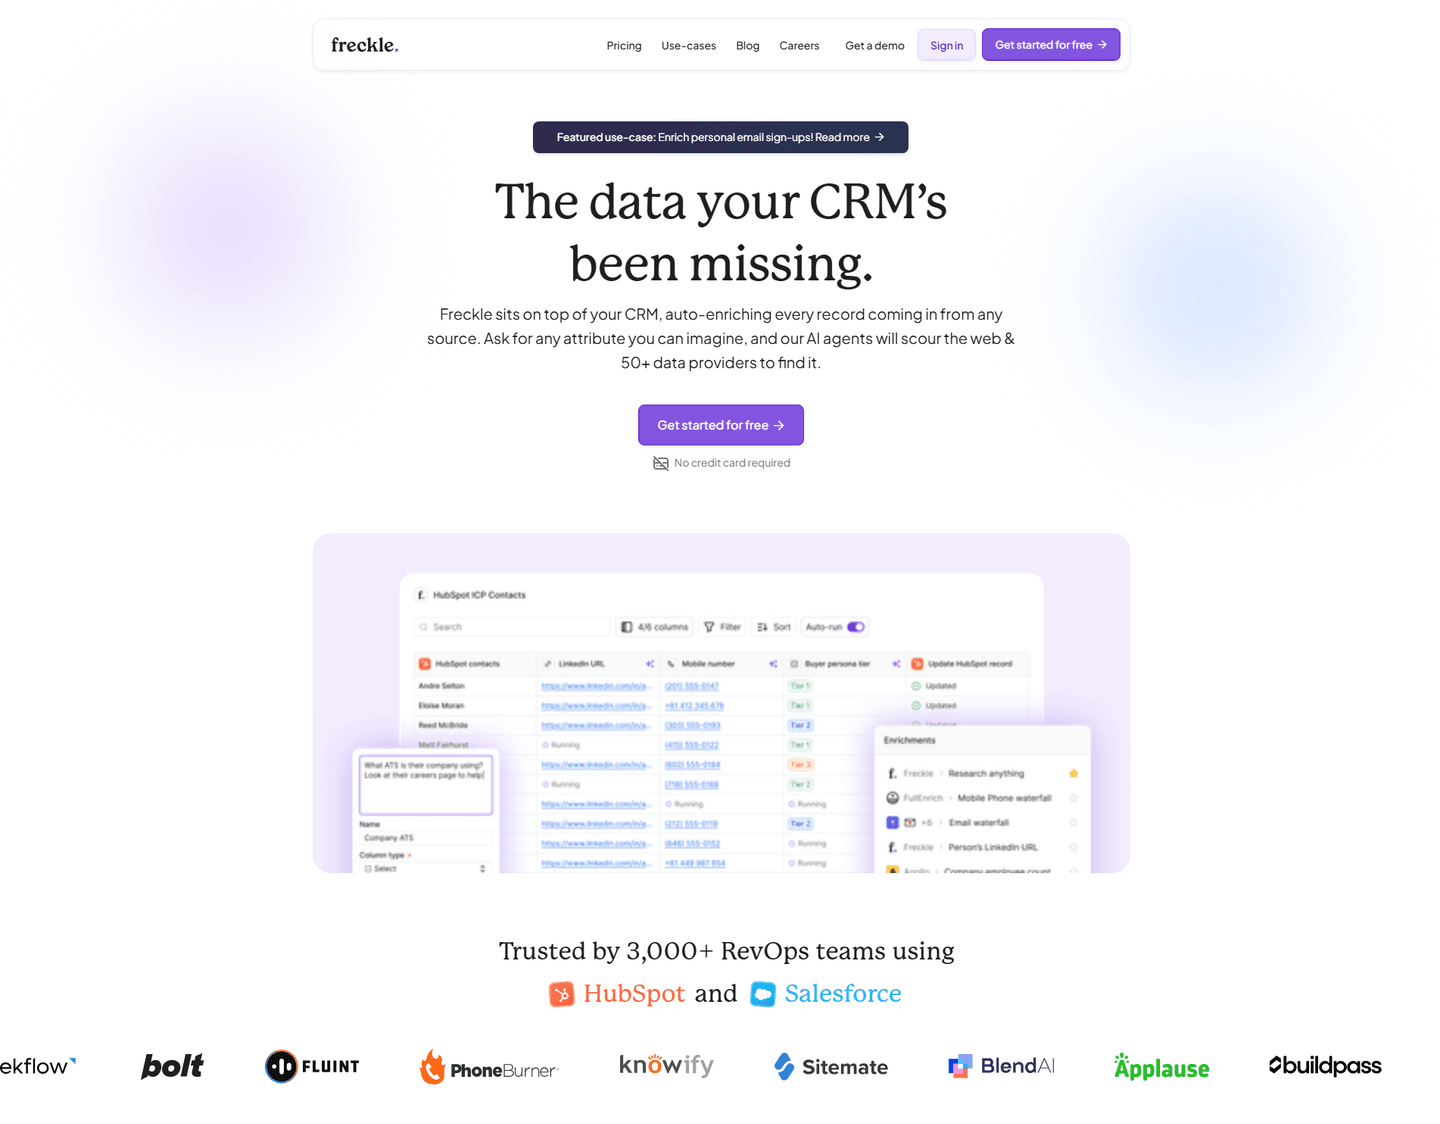
Freckle, Data enrichment explained in three steps, not three paragraphs.
5 years CRO + SEO at Qonto (2021–2025). After advising 15+ SaaS on their websites (Payfit, Pigment…), the same patterns kept breaking, so I decided to build the source of truth on what works on the web: the intelligence layer every tool, builder, and team uses to ship sites that perform.
“Freckle makes a technical data enrichment workflow feel effortless. Bold action verbs (Import, Clean and enrich, Sync), paired with a data flow diagram showing email-to-enriched-profile transformation, plus multiple import options from CRM, webhooks, and CSV, create immediate operational clarity.”
What makes this page stand out
The clear product explanation — sits on top of your CRM, auto-enriches every record from any source — makes the integration model instantly understandable for RevOps buyers
"Ask for any attribute you can imagine" positions the AI enrichment as limitless and flexible, differentiating from rigid enrichment tools that only provide pre-defined data fields
50+ data providers aggregated into a single enrichment layer creates a genuine data breadth advantage over tools that rely on a single proprietary database
Product screenshot showing real HubSpot integration with enrichment in action makes the value tangible — buyers can immediately see how Freckle fits into their existing workflow
Section we love
·Hero
1Problem-first headline (The data your CRM has been missing) hooks RevOps teams who already feel the gap in their pipeline
2Trusted by 3,000+ RevOps teams with HubSpot and Salesforce integration logos signals this fits their existing stack
3Real enrichment UI showing data fields and record matching gives prospects a concrete picture of the product at work
4Double risk reducers (Get started for free + No credit card required) remove every friction point from the first click
5Audience specificity at two levels: RevOps teams in the social proof and CRM users in the headline
03
Demodesk
77/100
What makes this page stand out
The hero stacks two CTAs—“Try for free” first and “Watch Demo” second—to cover self-serve and evaluators.
The above-the-fold trust block shows a 4.9/5 rating with five stars and a red G2 logo.
The customer proof row includes recognizable logos like AUTO1.com, Holidu, and WorkMotion beneath the hero visuals.
The “Automate all your sales workflows” section uses “trigger, the logic, and the outcome” language and repeats “Try Now” CTA.
Section we love
·Trust
1Stacked compliance seals (GDPR Compliant, ISO 27001, security shield) answer enterprise security questions up front
2G2 badge with a 4.9/5 score and five stars adds third-party validation alongside the self-claimed compliance
3Mixing certifications with a review score gives two different proof types, not just repeated badges
4Copy (control over what is recorded, who sees it, GDPR-compliant and auditable) frames privacy as a performance enabler
04
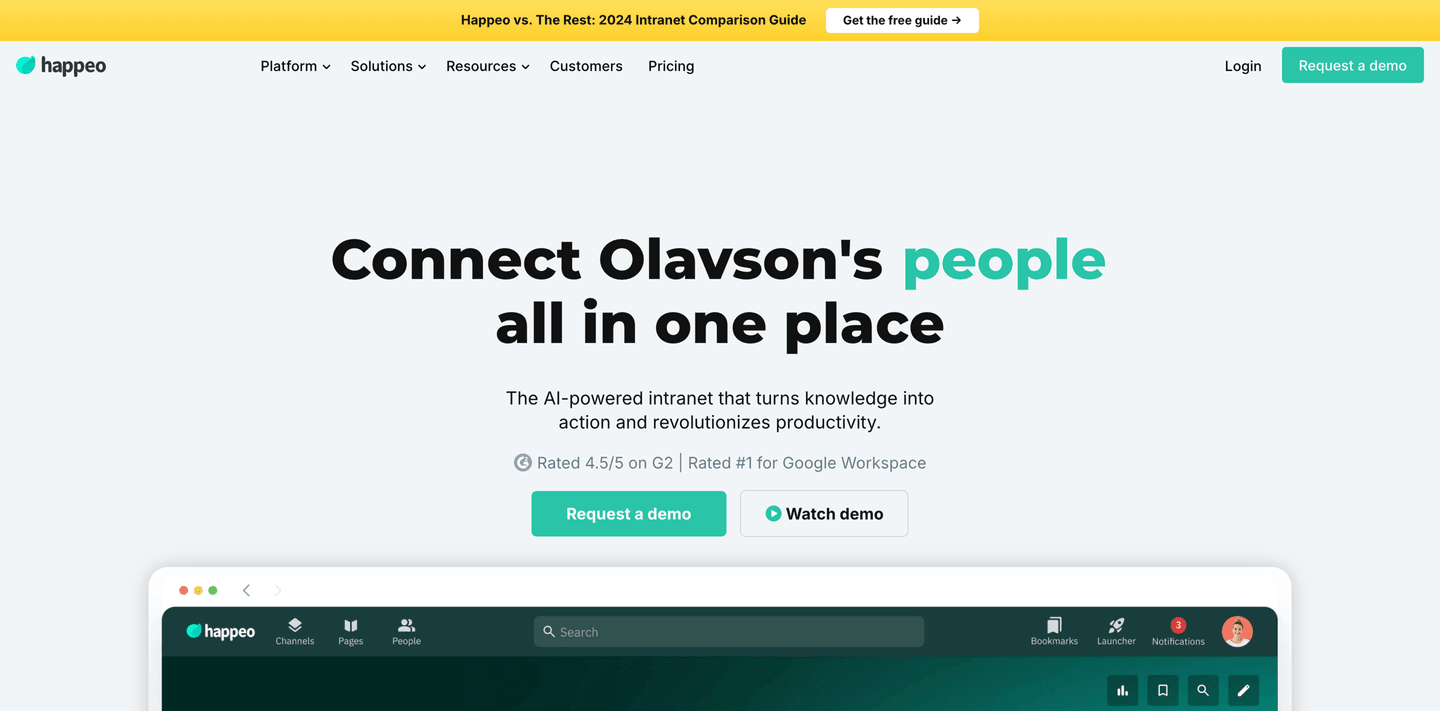
Happeo, AI-powered intranet with proof and product in the first viewport.
5 years CRO + SEO at Qonto (2021–2025). After advising 15+ SaaS on their websites (Payfit, Pigment…), the same patterns kept breaking, so I decided to build the source of truth on what works on the web: the intelligence layer every tool, builder, and team uses to ship sites that perform.
“Happeo layers double social proof in the hero, G2 4.5 stars and Rated #1 for Google Workspace, alongside a real intranet UI with Channels, Pages, and People tabs. Dual CTAs let buyers choose between requesting a demo and watching one, reducing decision friction for different intent levels.”
What makes this page stand out
"The intranet for companies that have outgrown drive, email and chat and need one official place without turning it into a 6-month project" — exceptionally specific pain point identification.
Design patterns we see across high-performing B2B pages
Across 247 B2B pages reviewed, the pages that convert tend to make the first screen do one job: state a clear promise and remove obvious doubt.
The strongest patterns pair specific, outcome-led claims with single-focus layouts, then back those claims with proof that feels easy to verify for a first-time visitor, especially important in B2B website design where buyers are evaluating on behalf of a team, not just themselves. Use website section examples to compare how these building blocks show up across page types.
1Named customers (Cate McCafferty at HubSpot, Kalvin Richan at Forecastr) put real faces and titles on the proof
2Hard numbers stack up: 30 percent faster activation, 1,500+ app installs, 58 percent less implementation time
3The 4.8 G2 average from an independent review site adds third-party validation
4The 2.5x increase in onboarding capacity ties the product directly to a business outcome
5The customer logo row (Circle, ProjectWorks, KitchenSync) broadens the proof beyond a single vertical
Reviewed design-pattern pick from Arrows’s trust section.
What I love about this section
Named customers (Cate McCafferty at HubSpot, Kalvin Richan at Forecastr) put real faces and titles on the proof
Hard numbers stack up: 30 percent faster activation, 1,500+ app installs, 58 percent less implementation time
The 4.8 G2 average from an independent review site adds third-party validation
The 2.5x increase in onboarding capacity ties the product directly to a business outcome
Overlooked sections that quietly drive clarity and trust
In this set, navigation and other "utility" sections often do more conversion work than teams expect: they shape product understanding, reduce decision friction, and route different buyer intents before visitors even reach the hero.
The biggest gaps usually appear where the page should explain the workflow, segmentation, or credibility story in plain language. When those sections are thin, the hero gets forced to do all the trust work, and visitors are left guessing about fit.
1Blue Book a demo button gives the navbar a clear, persistent primary conversion action
2Solutions mega menu splits into a USECASES column (Streamline operations, Compliance) and an INDUSTRIES column (Manufacturing, Healthcare and Medical) so visitors browse by task or vertical
3Featured SOLUTION and blog cards with images on the right of the dropdown add a richer content hierarchy
4Pricing link plus a Call sales phone number cover both self-serve and high-touch buyer paths
Reviewed overlooked-section pick from Administrate’s navbar section.
What I love about this section
Blue Book a demo button gives the navbar a clear, persistent primary conversion action
Solutions mega menu splits into a USECASES column (Streamline operations, Compliance) and an INDUSTRIES column (Manufacturing, Healthcare and Medical) so visitors browse by task or vertical
Featured SOLUTION and blog cards with images on the right of the dropdown add a richer content hierarchy
Pricing link plus a Call sales phone number cover both self-serve and high-touch buyer paths
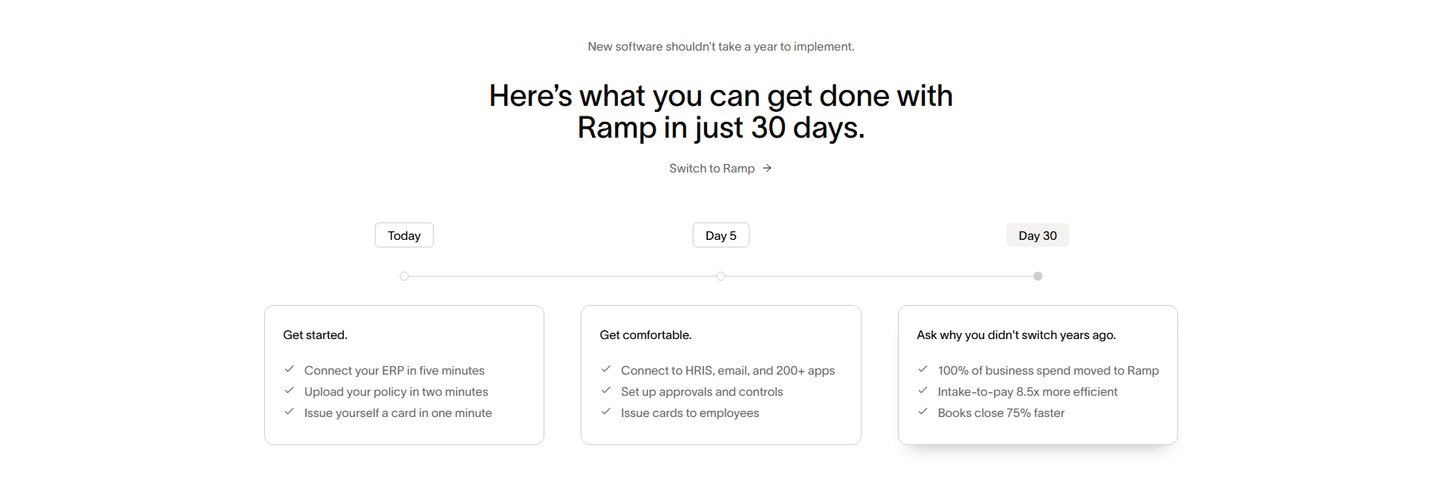
1A Today to Day 5 to Day 30 timeline breaks onboarding into three discrete, dated milestone cards
2Timeframes are everywhere and specific (just 30 days, connect ERP in five minutes, issue a card in one minute)
3Effort framing leads the section (new software shouldnt take a year to implement) and per-task minute claims
4Day 30 previews hard outcomes (100% of spend moved, books close 75% faster, intake-to-pay 8.5x more efficient)
5A Switch to Ramp link is embedded right under the headline as the section CTA
Reviewed overlooked-section pick from Ramp’s how it works section.
What I love about this section
A Today to Day 5 to Day 30 timeline breaks onboarding into three discrete, dated milestone cards
Timeframes are everywhere and specific (just 30 days, connect ERP in five minutes, issue a card in one minute)
Effort framing leads the section (new software shouldnt take a year to implement) and per-task minute claims
Day 30 previews hard outcomes (100% of spend moved, books close 75% faster, intake-to-pay 8.5x more efficient)
Use the examples below as prompts for what to standardize, not just what to redesign.
Checklist: a practical audit for B2B website design
If you're iterating on a B2B homepage design, this checklist helps you spot missing sections and messaging gaps quickly, especially around Hero, Value Proposition, and Cta.
Run it on your current page, then decide what to rewrite, what to reorder, and what proof to add before you touch visual polish. For a faster baseline, you can also try our landing page analysis.
Built from 466 sections across 152 B2B homepages in this benchmark. Each check below is a move the highest-scoring pages share, each paired with a real example from the benchmark.
Hero
Can a skeptical buyer tell what you do in five seconds?
The hero makes it instantly clear what the product is and who it's for.
Example: Teamwork.com states the category outright with "The only platform built for managing client projects, profitably."
The real product shows above the fold.
Example: Scout opens on a real lead table with contacts at Microsoft, Salesforce, and Stripe instead of a hero graphic.
Proof is visible before the first scroll.
Example: Scoro surfaces a 4.5-star rating, 1000+ reviews, and Capterra and GetApp badges in the first screen.
Trust
Does the page earn belief before it asks for anything?
Claims are quantified.
Example: Samsara lines up named customer logos like DHL, Estes, Werner, and the City of New Orleans.
Recognizable customer logos borrow authority.
Example: Ramp anchors trust on a G2 5-star rating backed by 2,000+ reviews.
Security and compliance cues reassure the cautious buyer.
Example: Surfe names real seals (ISO 27001:2013, ANAB Accredited, GDPR Compliant) instead of vague trust language.
Value proposition
Is the value concrete, or just adjectives?
Benefits are specific.
Example: Clay runs three bolded props side by side, "act on data at scale," "build dynamic audiences," and "time outreach perfectly."
The promise is quantified with a number or a timeframe.
Example: Ahrefs quantifies the promise with "100+ flexible API endpoints" powering custom dashboards and automated reporting.
A unique mechanism explains why the product is different.
Example: Malt lists four distinct propositions in sequence, "Lightning fast," "Safe and secure," "Time saving," and "Community first."
Features
Do features connect to outcomes the buyer cares about?
Feature copy leads with the outcome.
Example: Webflow opens with "Focus on building, not maintenance," putting the outcome ahead of the hosting feature.
The section shows the outcome.
Example: SignOnSite shows the result with mobile app screenshots and a before/after stat, "40mins" struck through to "6 mins" on inductions.
Each feature maps a real pain to a measurable result.
Example: Administrate names concrete pains, an instructor called in sick or equipment broken, then maps each to the fix.
Call to action
Does the next click feel safe to a cautious buyer?
One primary action dominates, with action-led copy.
Example: Pitch lets one "Start gaining insights" button own the block with no competing action.
The CTA shows the product or an asset.
Example: HubSpot leads with one boxed "Explore Breeze Agents" CTA over a lighter "Learn More" text link.
The gap most B2B pages leave open is pricing.
Pricing is the rarest section in the B2B set. Of 466 sections benchmarked, only 16 are pricing blocks clear enough to score, drawn from a handful of the 152 companies. The ones that do it make the cautious buyer's job easy. PandaDoc lines up four named plans, Free, Starter, Business, and Enterprise, each with a price and a target audience, so a visitor can compare without booking a call. Pages that bury pricing behind "contact sales" leave the cheapest trust on the table.
Interactive quiz
What would your B2B homepage score?
Question 1 of 5
0%
Can a B2B buyer identify what you do and who it is for in under 5 seconds?
"Workflow automation for ops teams" beats "the platform that empowers modern enterprises."
Reviewed by
Gabriel Amzallag , Founder, Web Anatomy
5 years CRO + SEO at Qonto (2021–2025). After advising 15+ SaaS on their websites (Payfit, Pigment…), the same patterns kept breaking, so I decided to build the source of truth on what works on the web: the intelligence layer every tool, builder, and team uses to ship sites that perform.
Quick answers based on our B2B website benchmark dataset.
What are the best B2B websites?
[01]
The strongest performers in this September 2026 benchmark are ProductLed, Freckle, Happeo, Synapsa, Parabola, and Scoro. Across 247 B2B homepages scored against 60+ criteria, these pages convert because they make the category and audience obvious in the first viewport. They also stack trust signals (review scores, named logos, quantified outcomes) before the ask.
What is B2B website design?
[02]
B2B website design is the practice of structuring a homepage to convert business buyers evaluating software, services, or platforms on behalf of a team. The strongest examples in this benchmark make the category obvious and prove it fast: ProductLed turns the navbar itself into a conversion asset with a six-tool free mega menu, Happeo pairs G2 4.5 stars with a real intranet UI in the hero, and Synapsa anchors the CTA with $100M+ in pipeline generated.
What is the biggest design mistake on B2B homepages?
[03]
Leading with vague positioning and delaying concrete proof of outcomes. The average page in this September 2026 benchmark scored 52.9. Top performers answer "what does this do and why should I trust you?" in the hero: Freckle turns data enrichment into three bold action verbs (Import, Clean and enrich, Sync), Scoro stacks Capterra and GetApp logos with 4.5 stars and 1000+ reviews, and Parabola names the pain directly with "Designed for teams stuck in spreadsheets."
What sections should a B2B homepage include?
[04]
A hero with one primary action, an early trust layer with logos, review scores, and quantified outcomes, a how-it-works or product overview, features tied to business outcomes, and use-case segmentation or audience routing. ProductLed maps the nav to the buyer journey; Parabola uses five tabbed use cases plus a "Not sure where to start" fallback for undecided visitors. Across 247 homepages, pages that stack these blocks convert most.
How much does a B2B website cost?
[05]
Costs range from a few thousand dollars for template builds to six figures for custom enterprise redesigns. Spend does not guarantee conversion. Across 247 homepages reviewed, the pages that score highest invest in clarity and proof, not visual polish. Only 2% reach the top tier. Focus budget where ProductLed, Synapsa, and Scoro invest: outcome-anchored CTAs, real product UI, and stacked third-party validation.
Where can I find great inspiration for my B2B website?
Use a structured rubric that checks clarity, trust, and friction instead of relying on subjective feedback. Run your page through the landing page analyzer for a section-by-section score against the same 60+ criteria used in this benchmark.