Pricing Table|
The pricing table compares plans and features side by side so buyers can pick. Explore 38 scored examples and see how the best design their tables.
Updated September 2026
Showing 1–29 of 38 examples


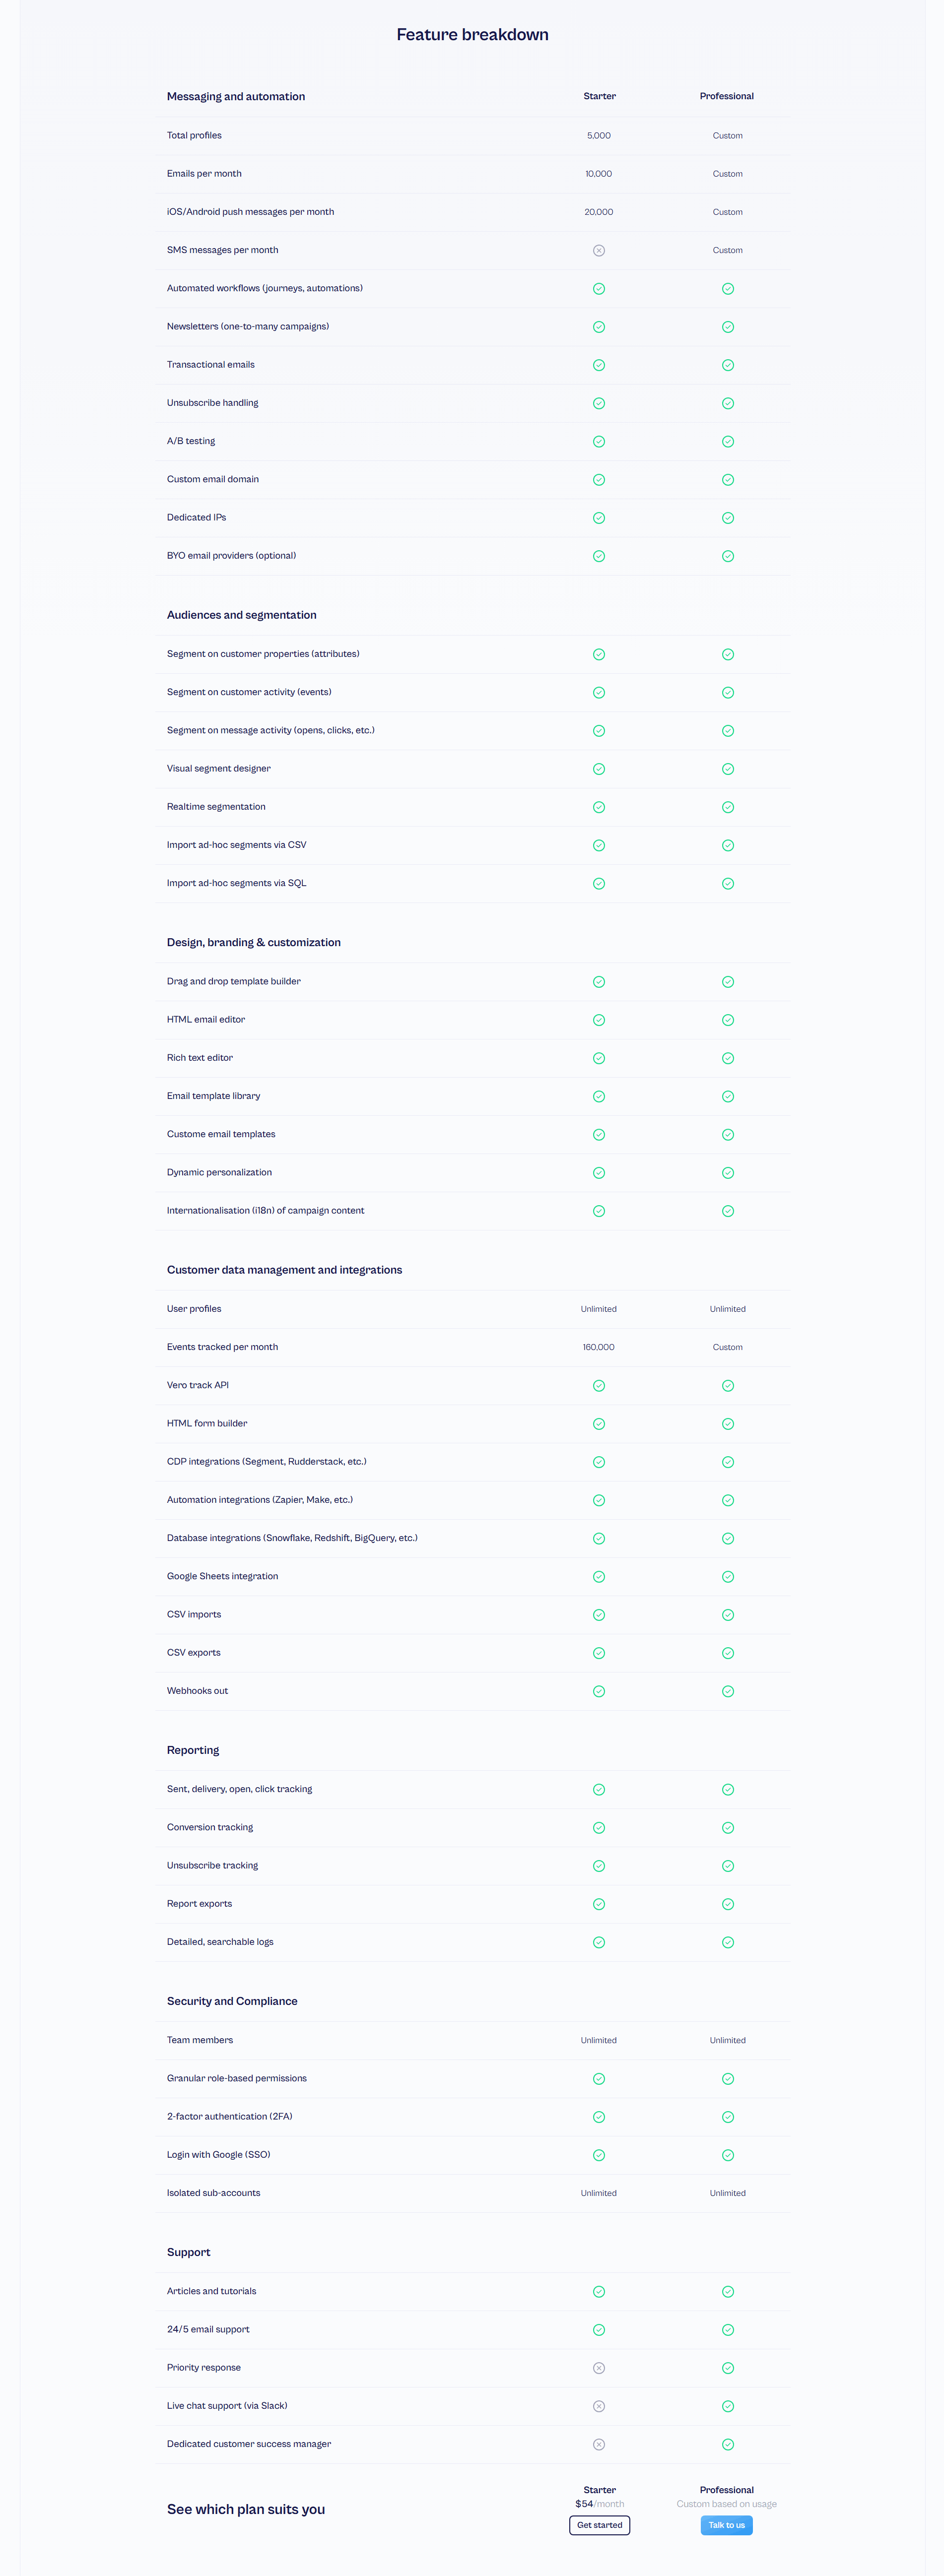
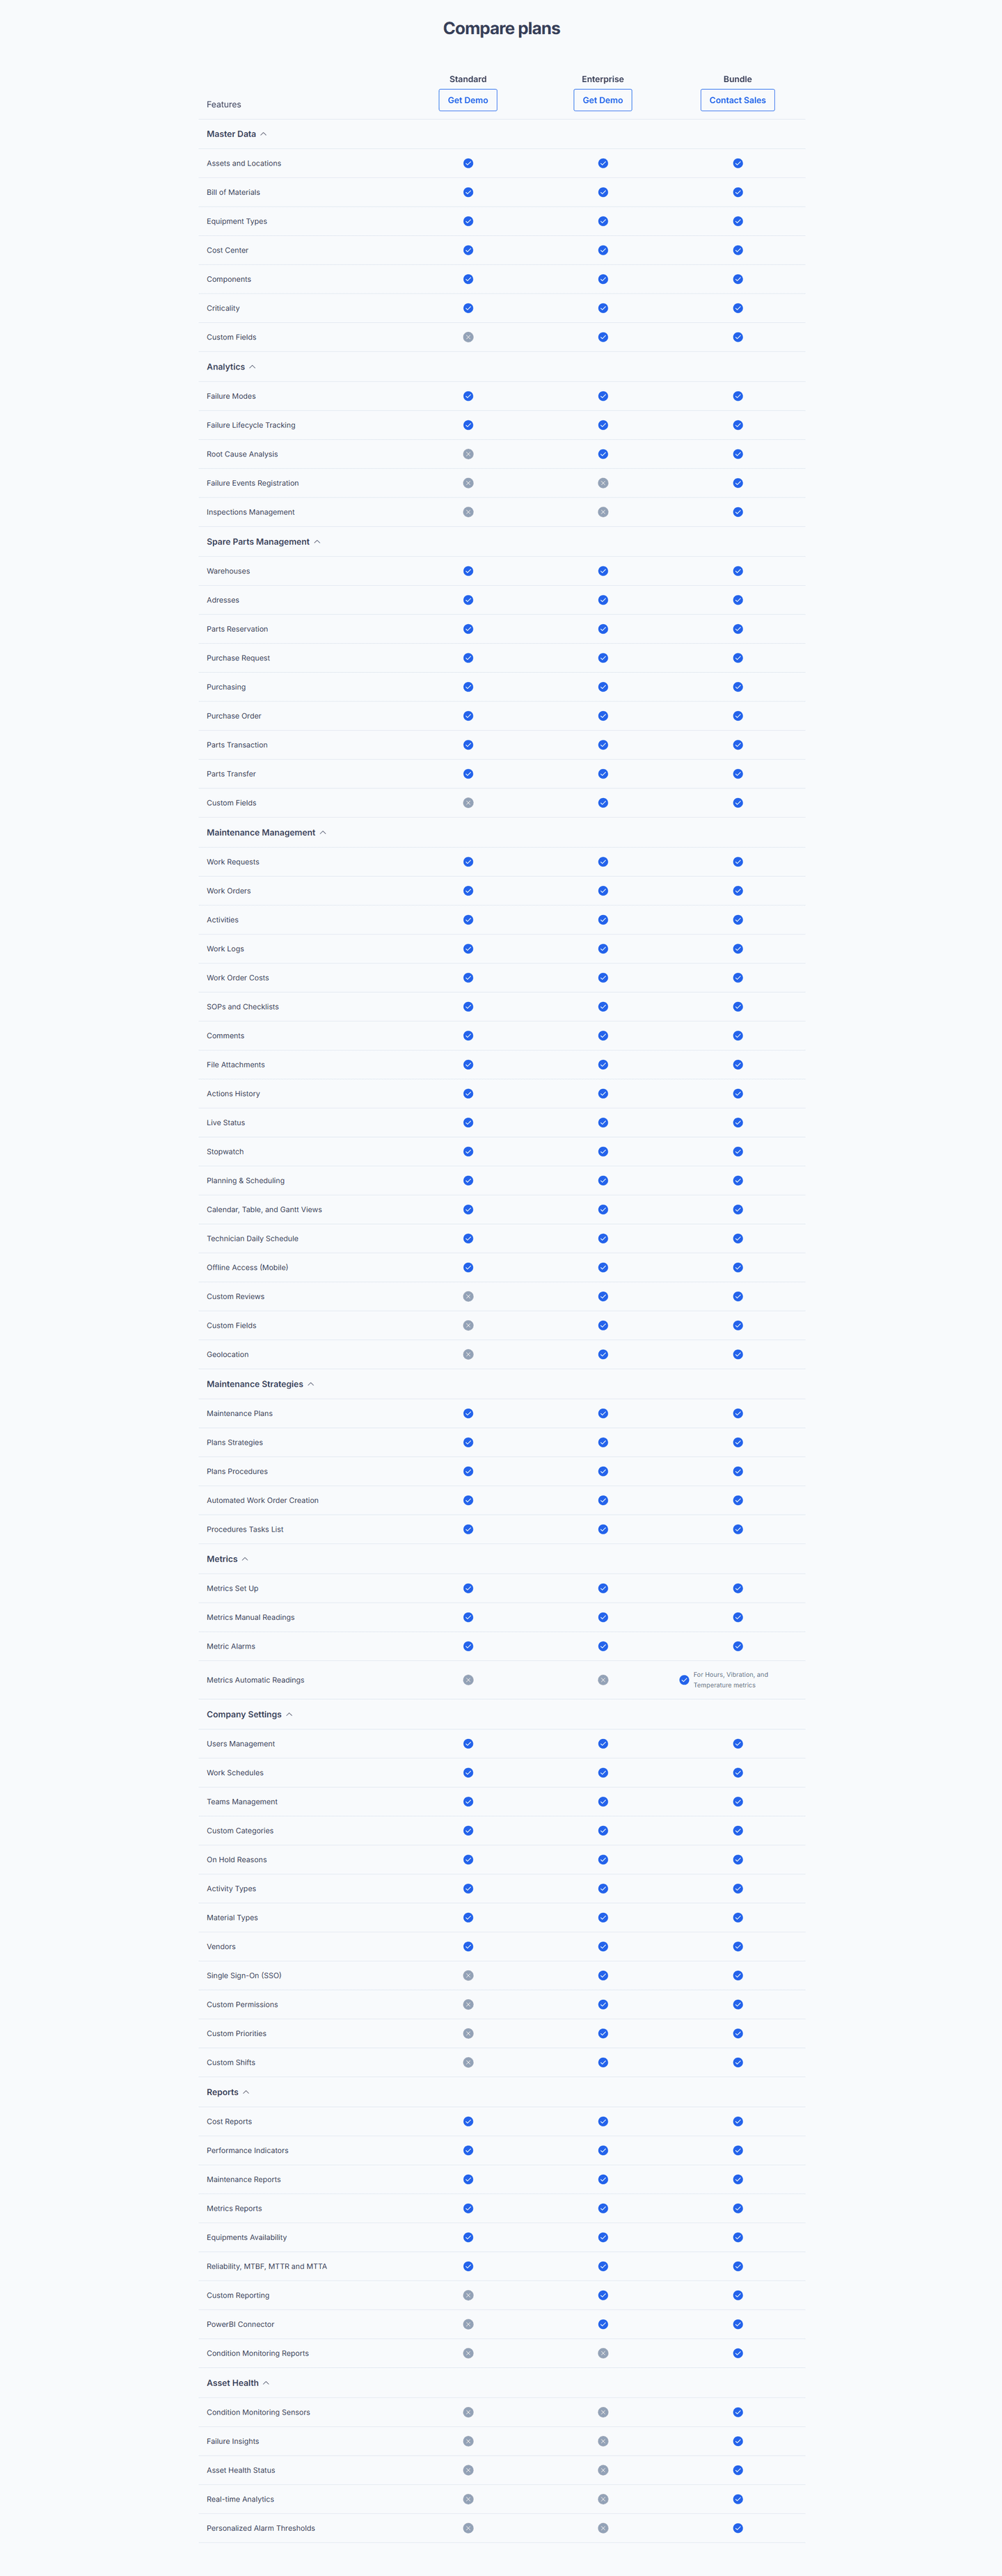
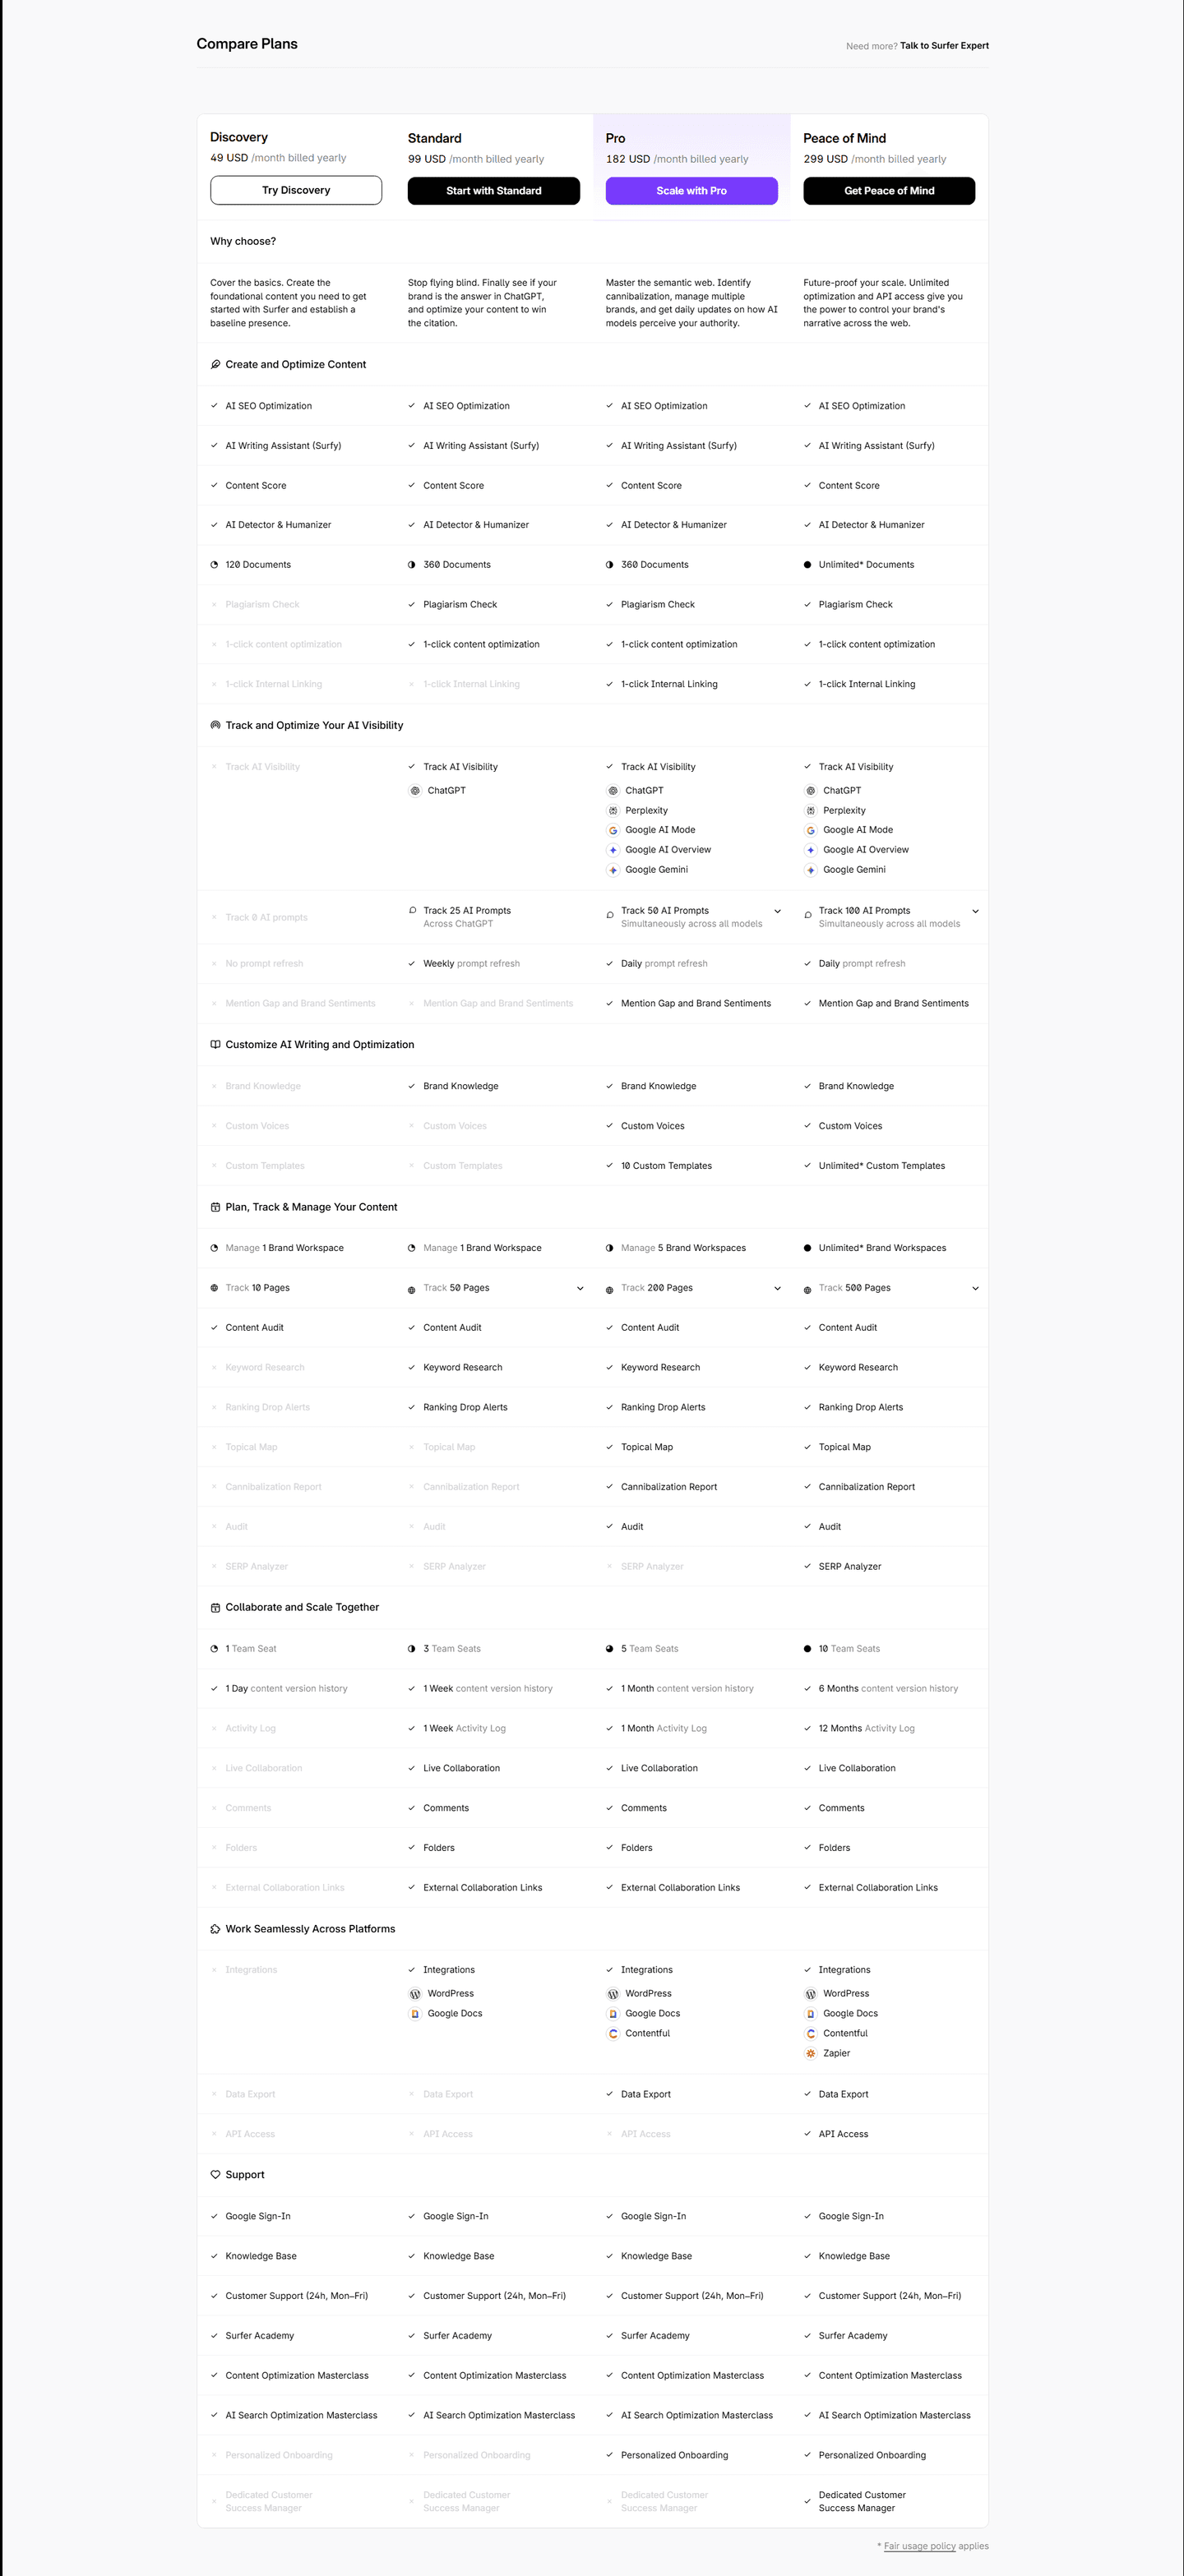
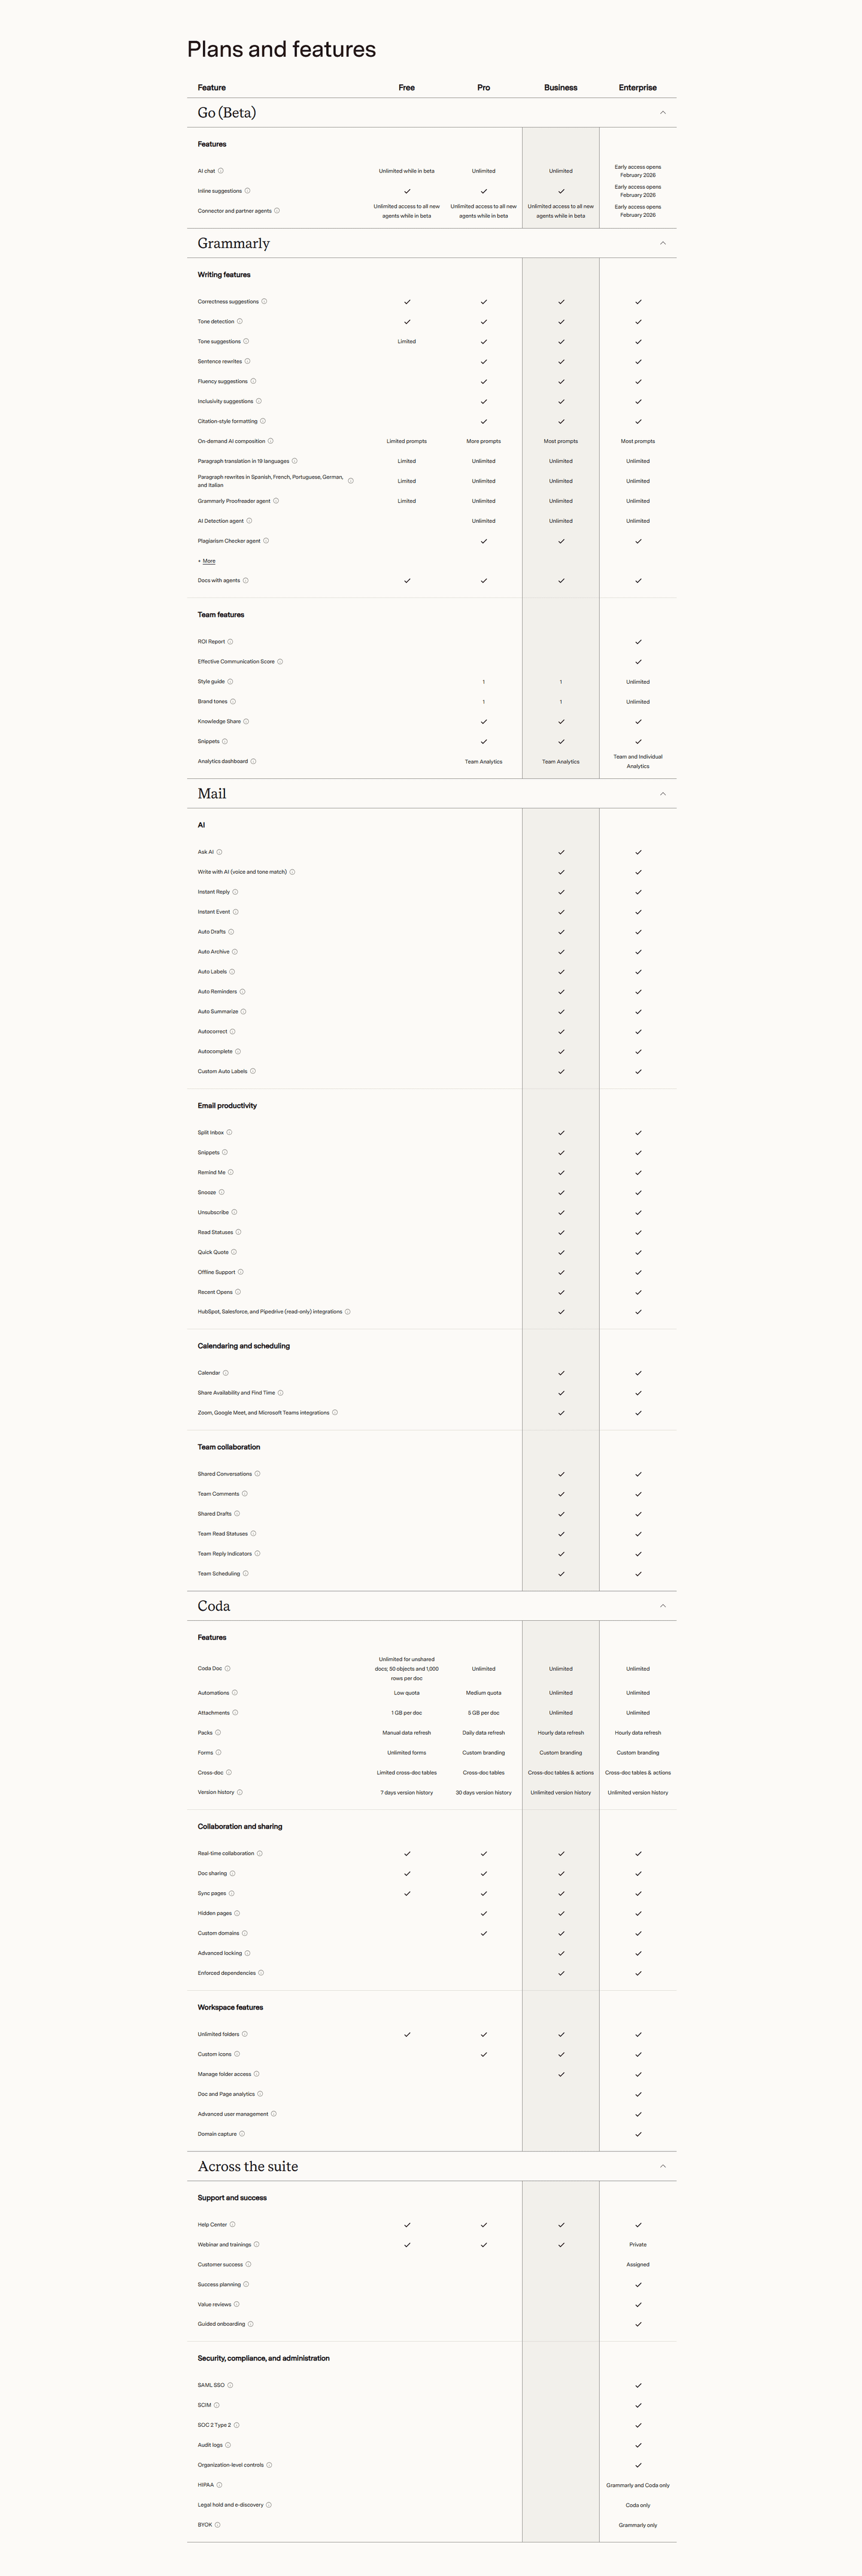

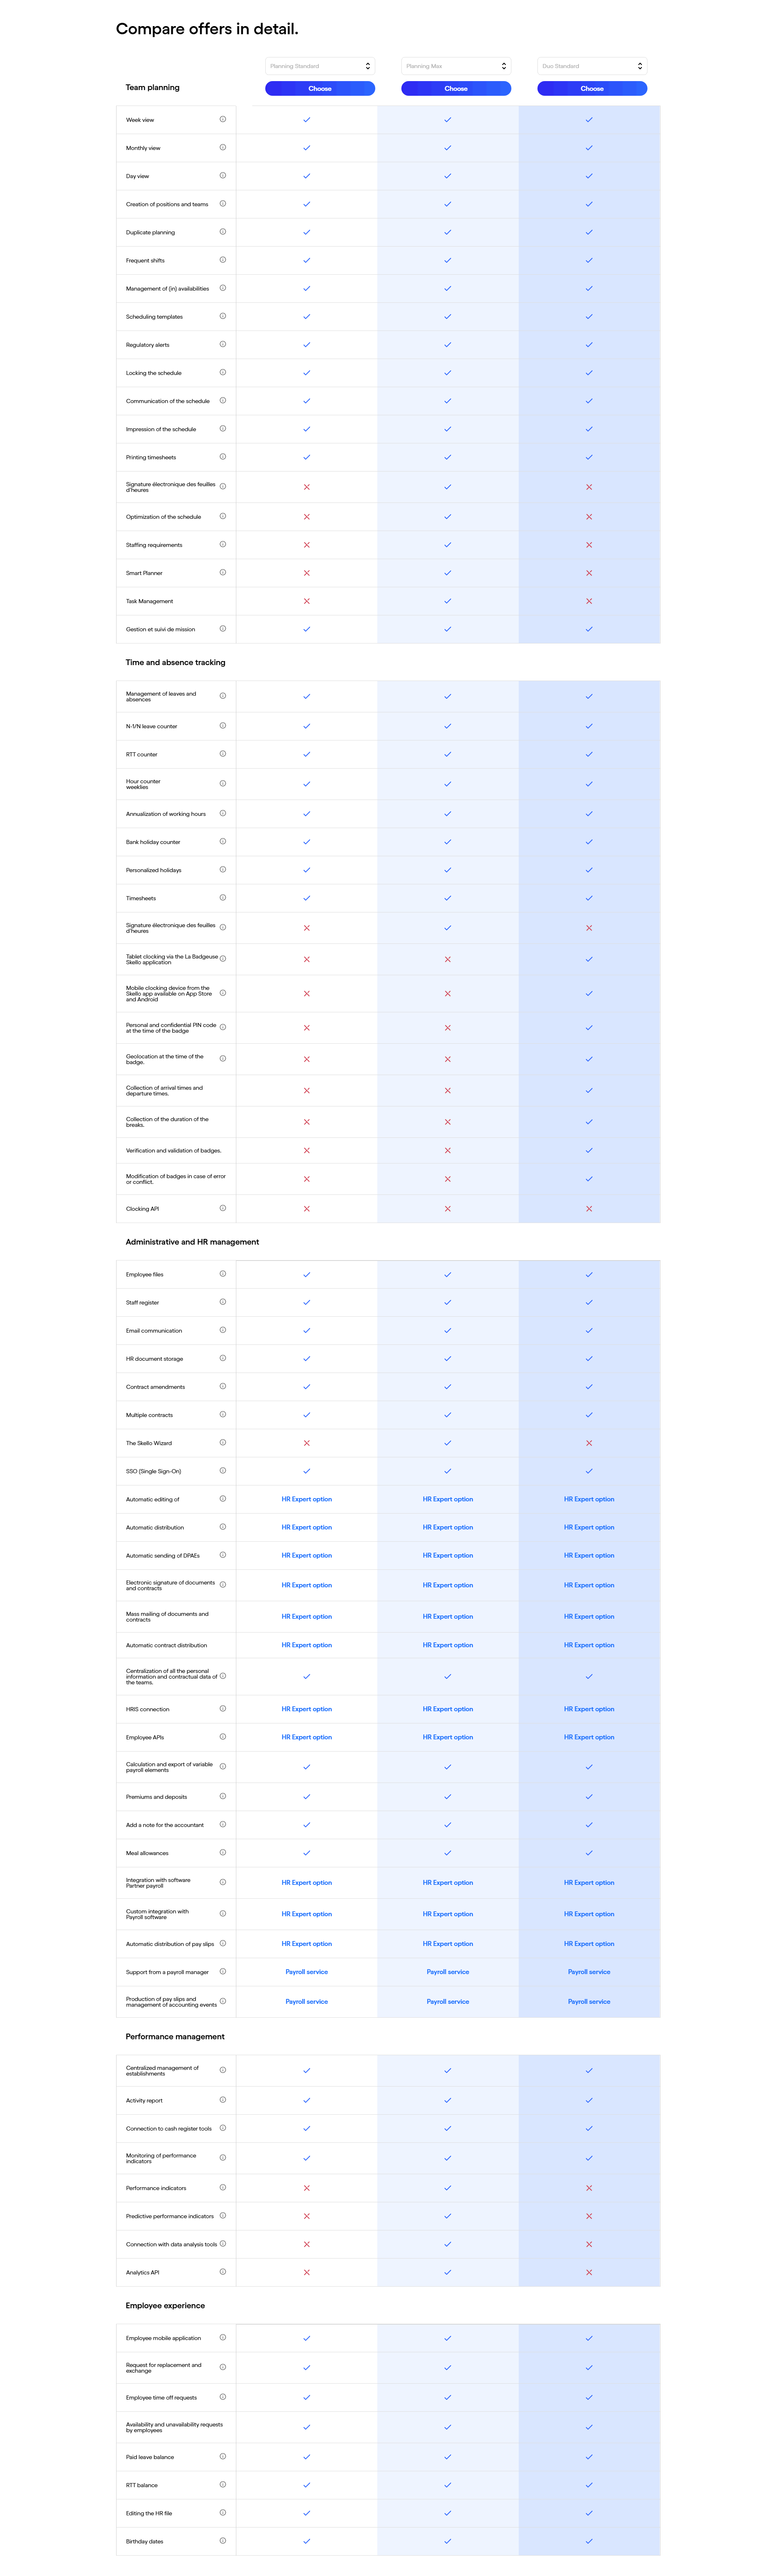


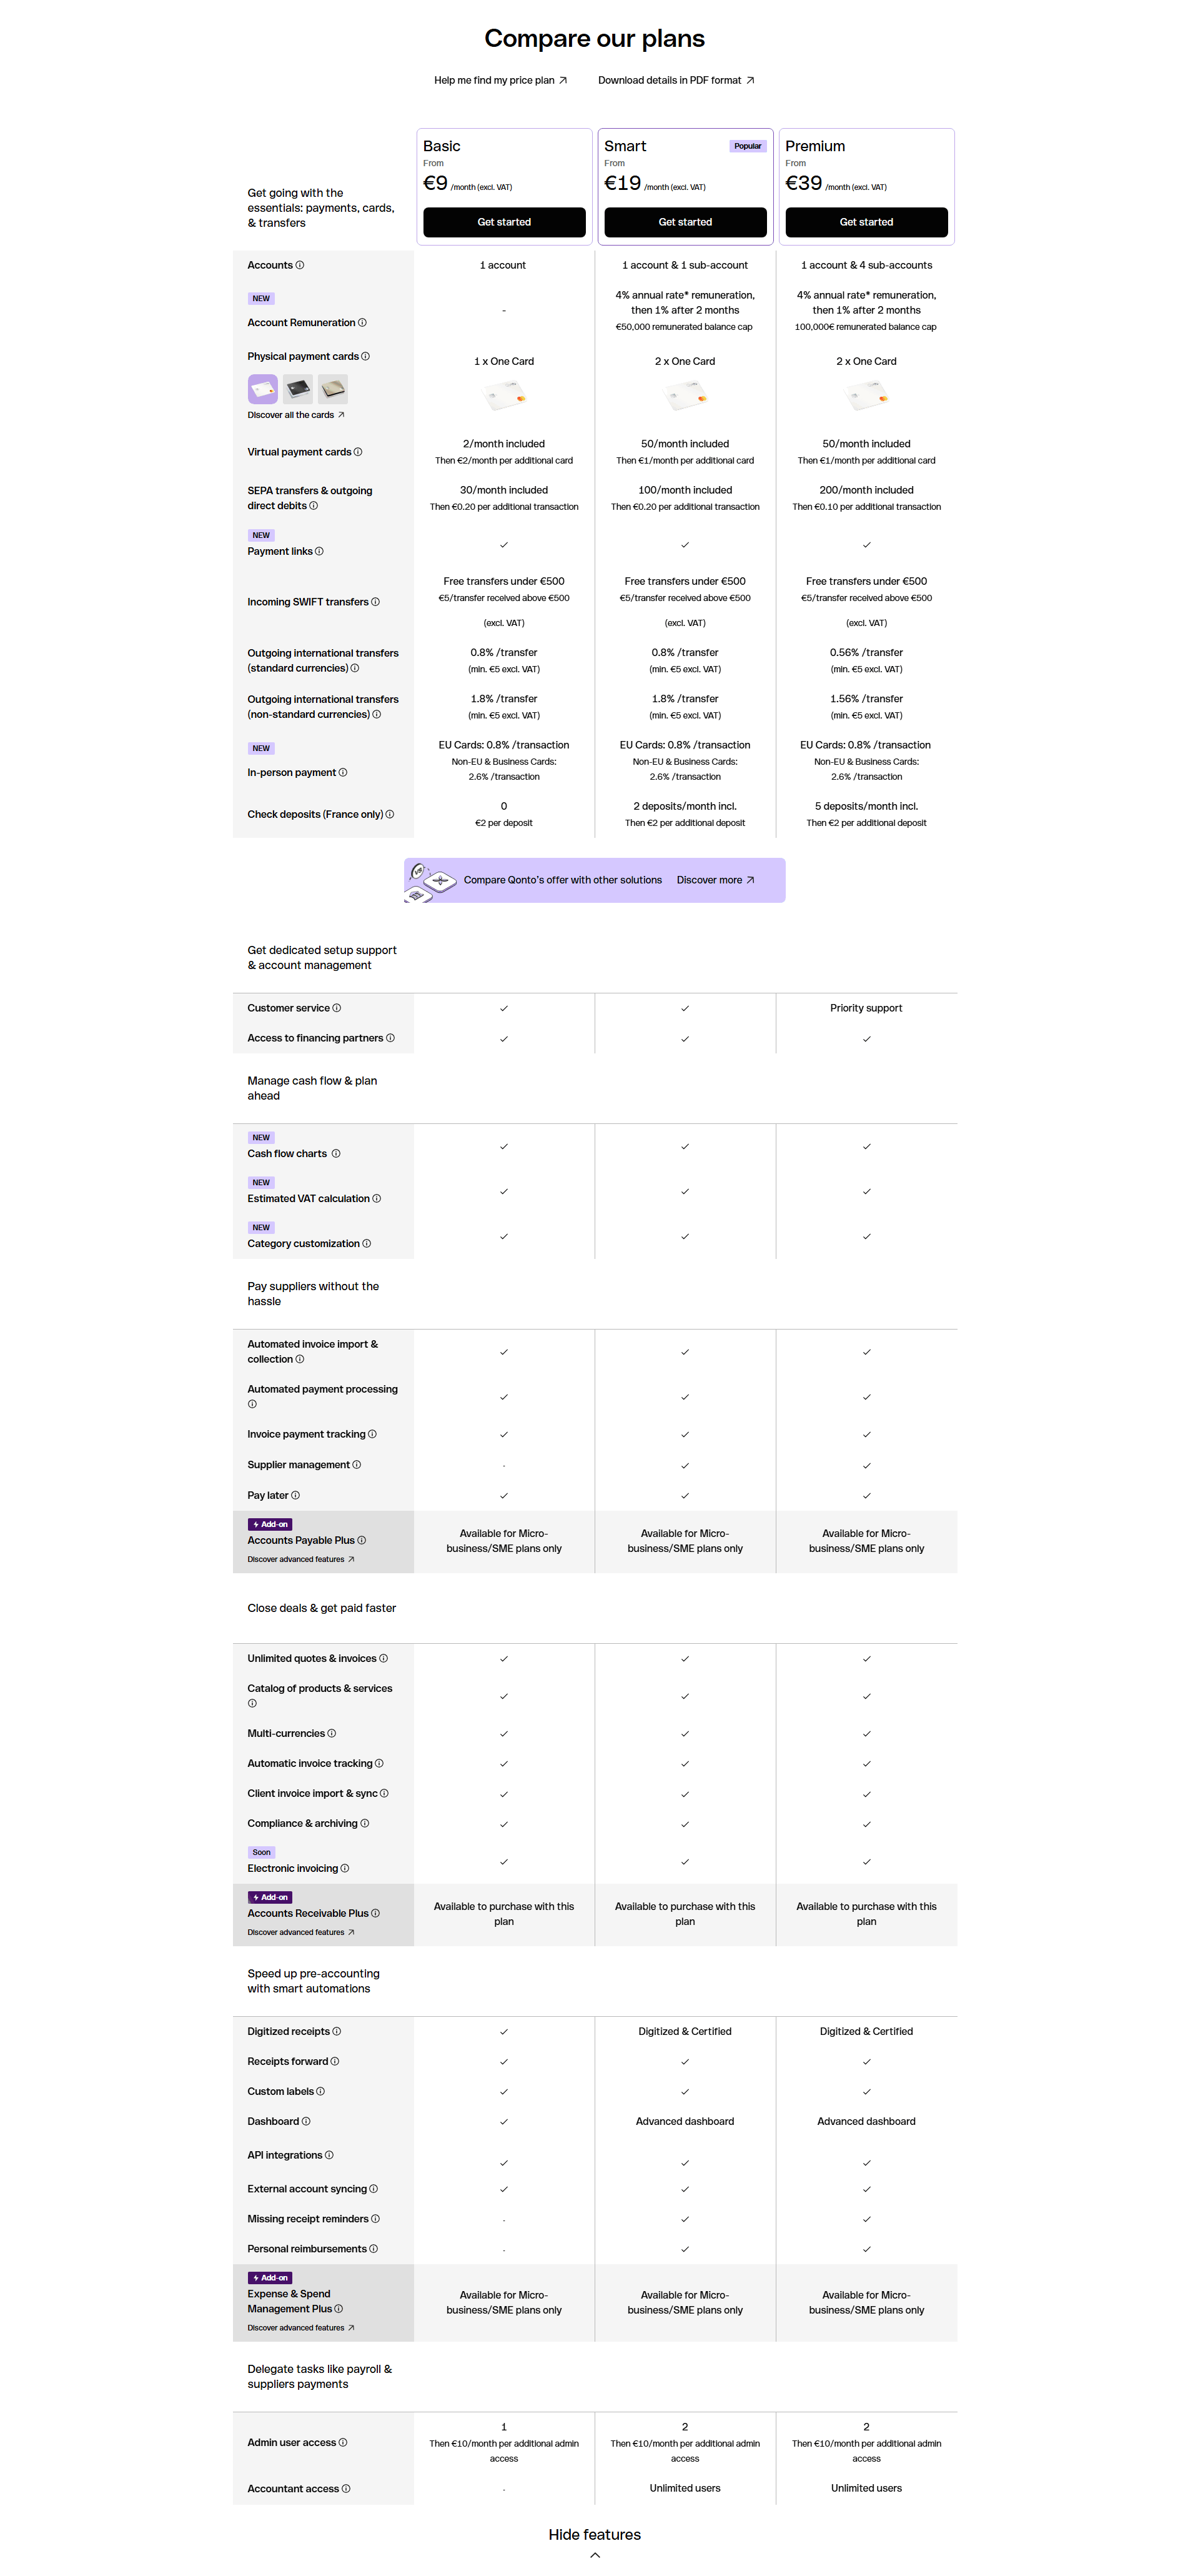
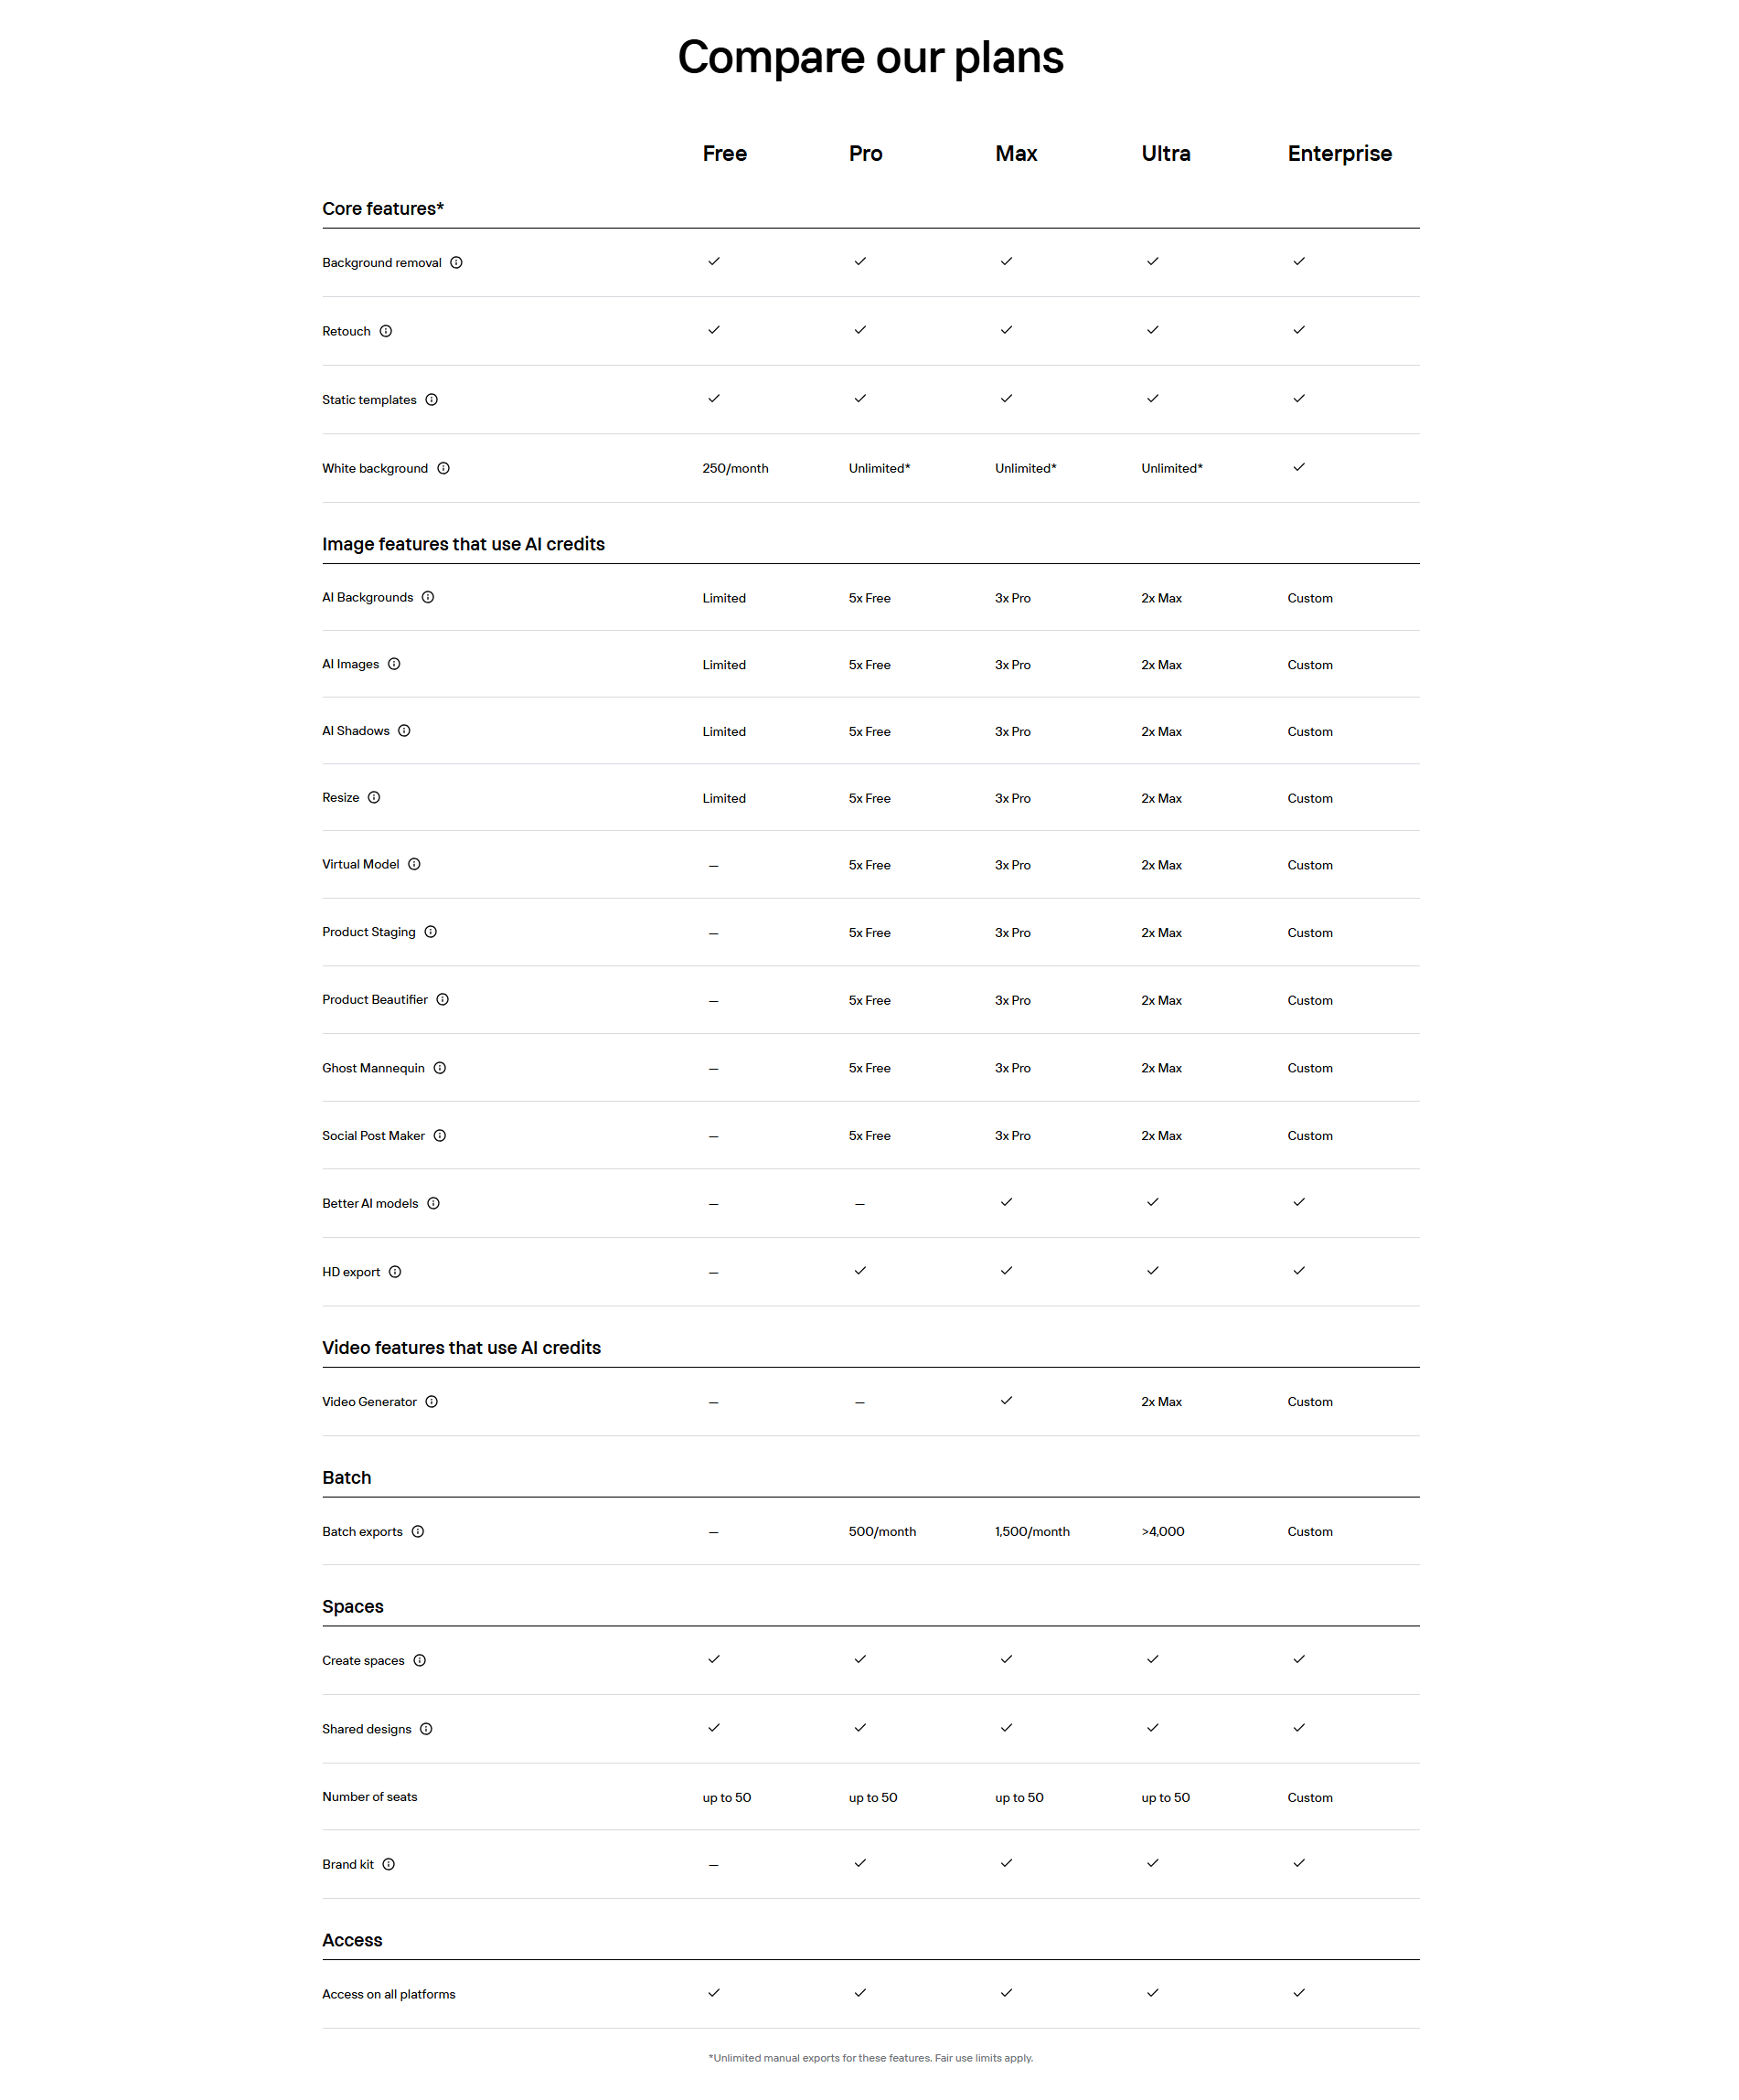
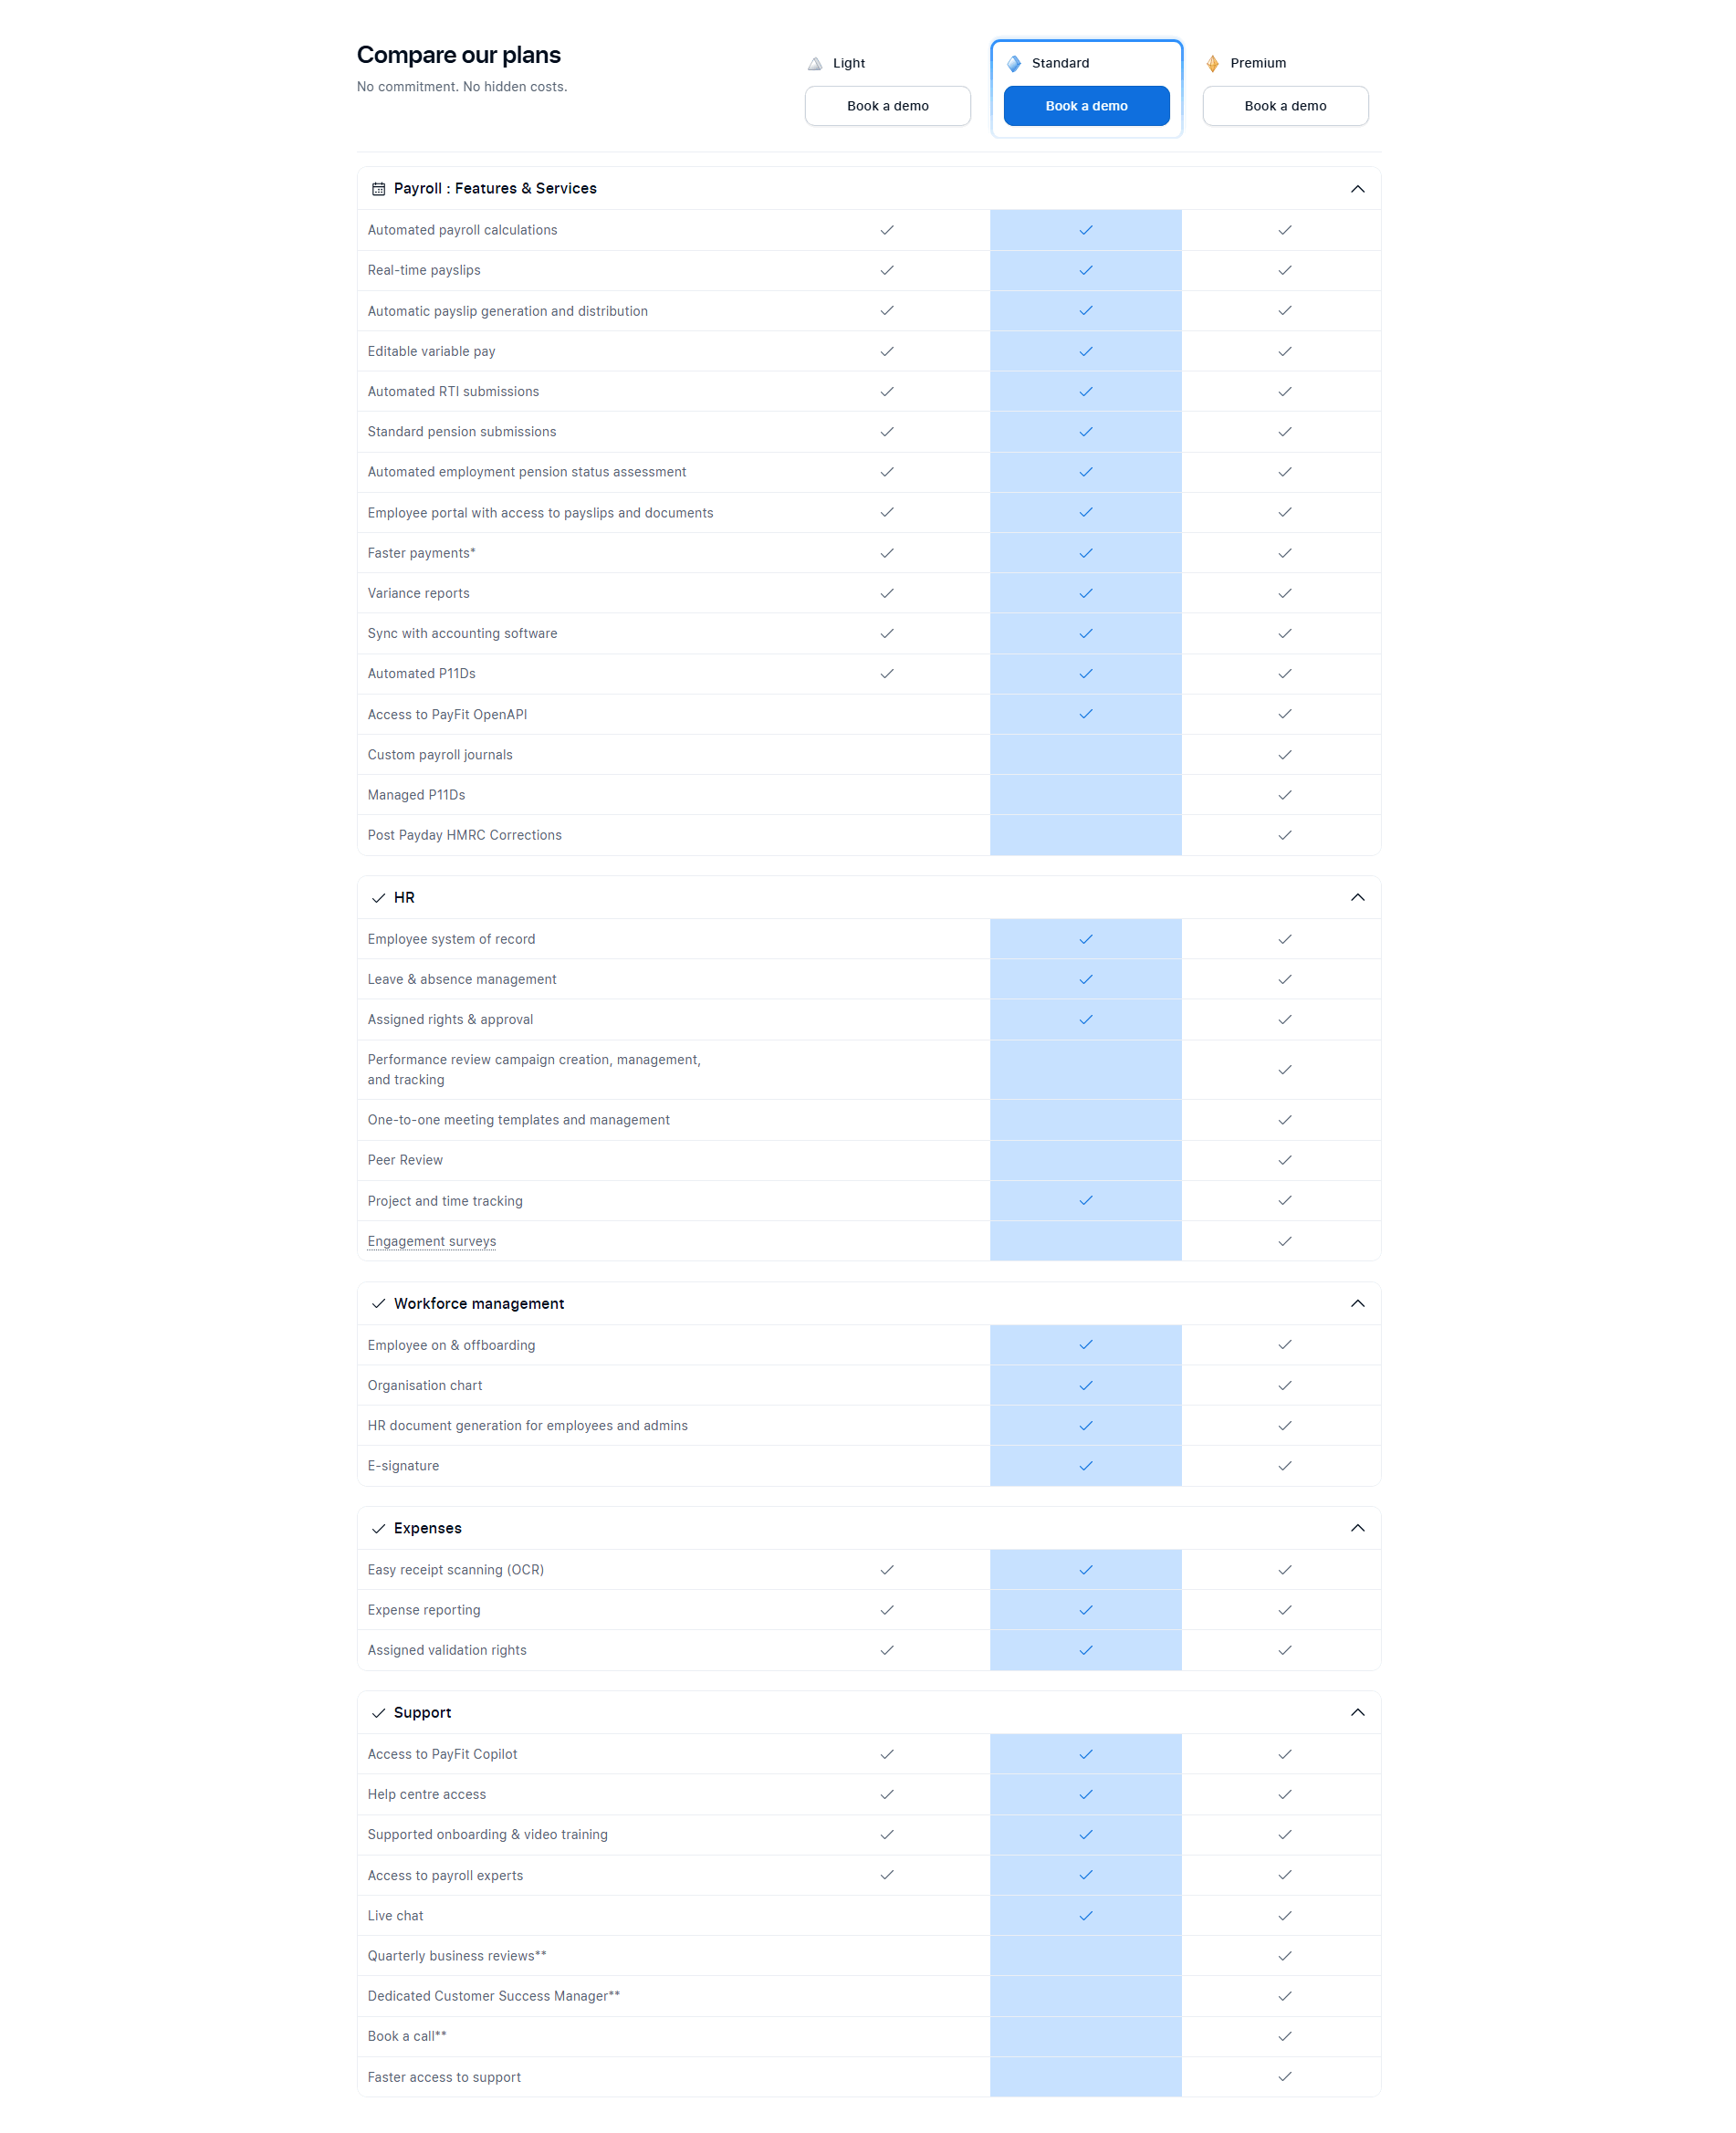
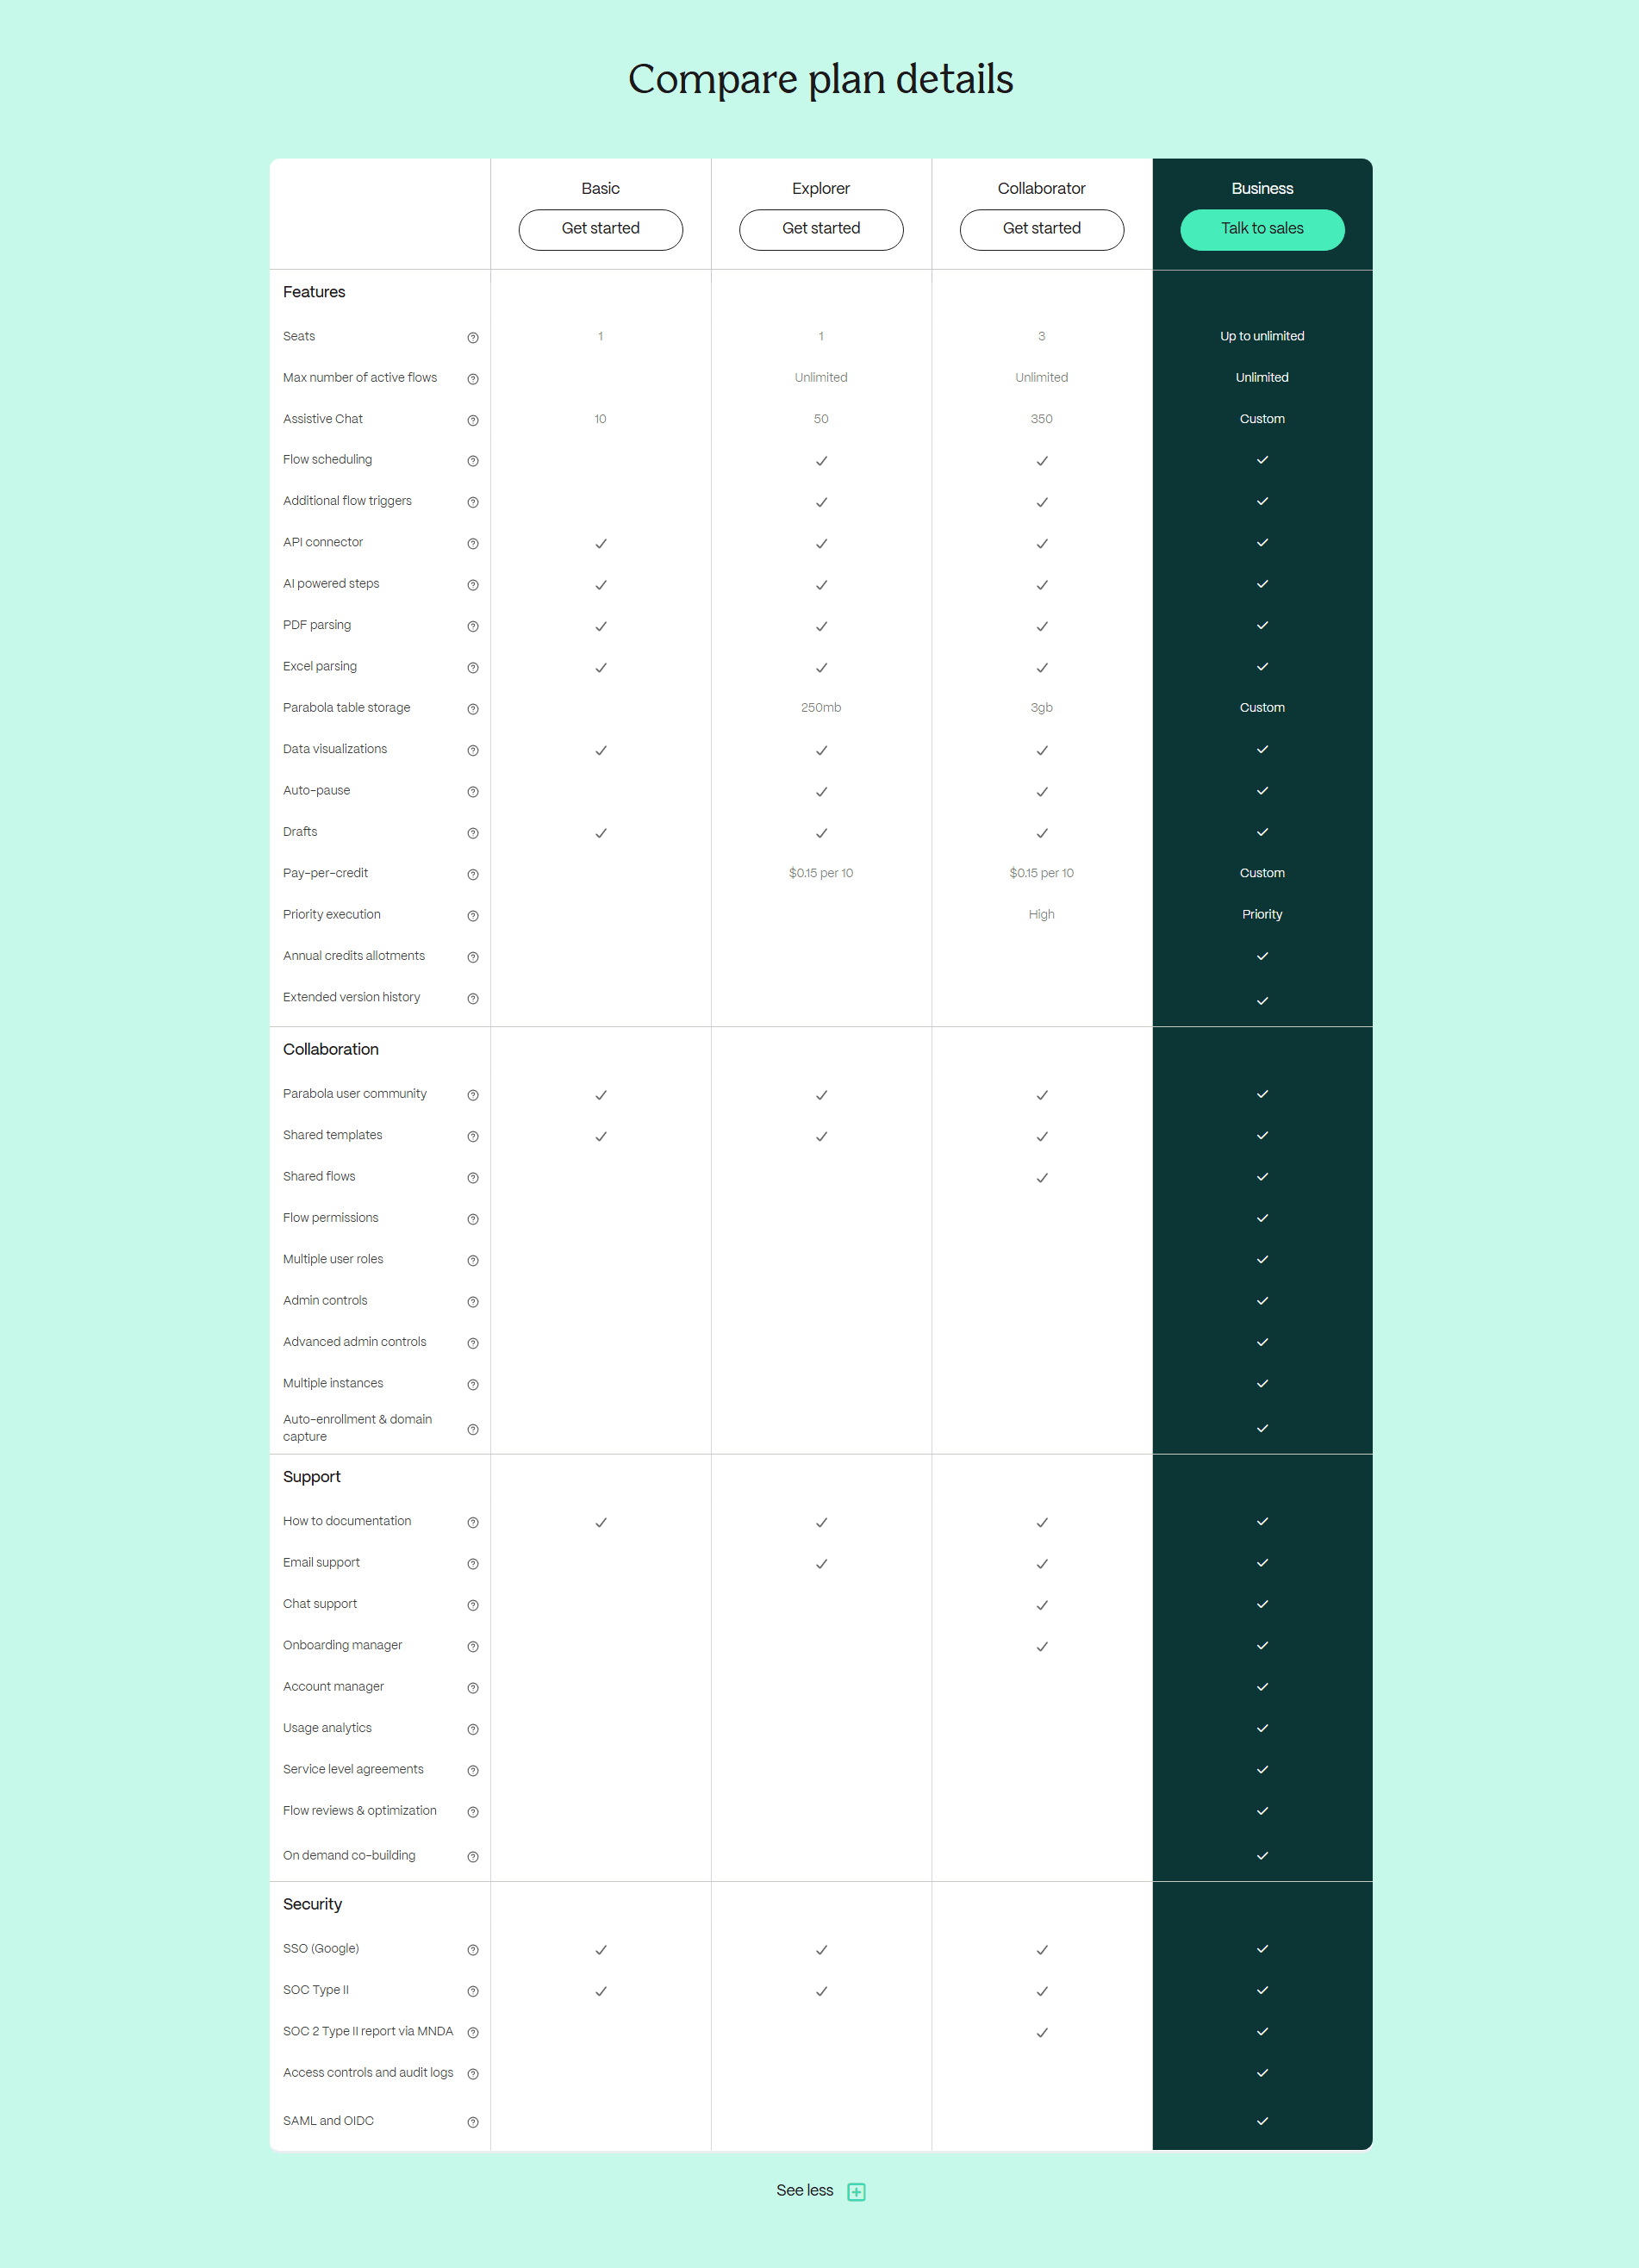
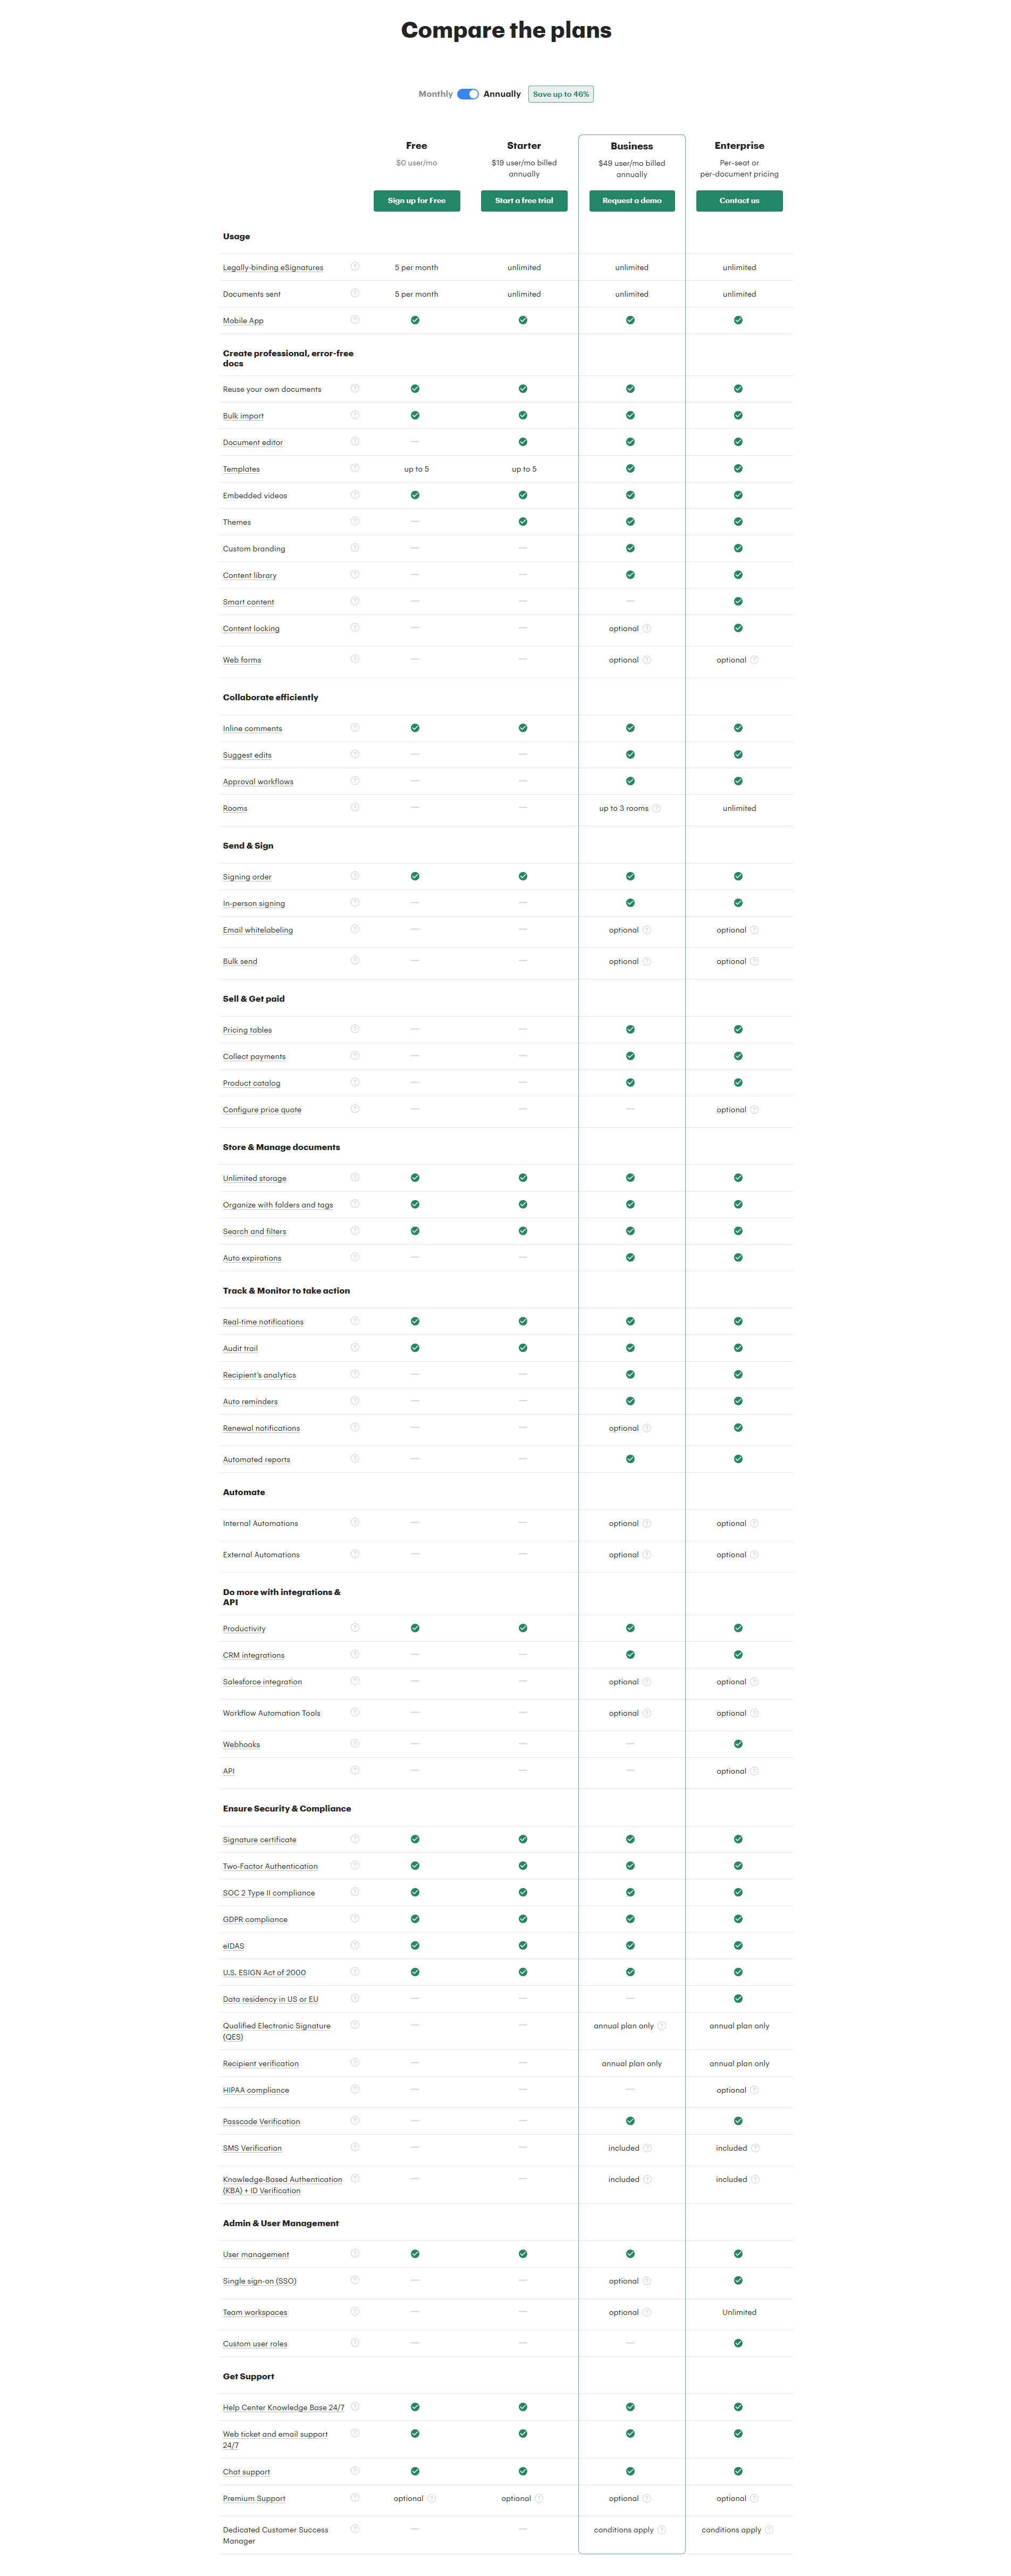

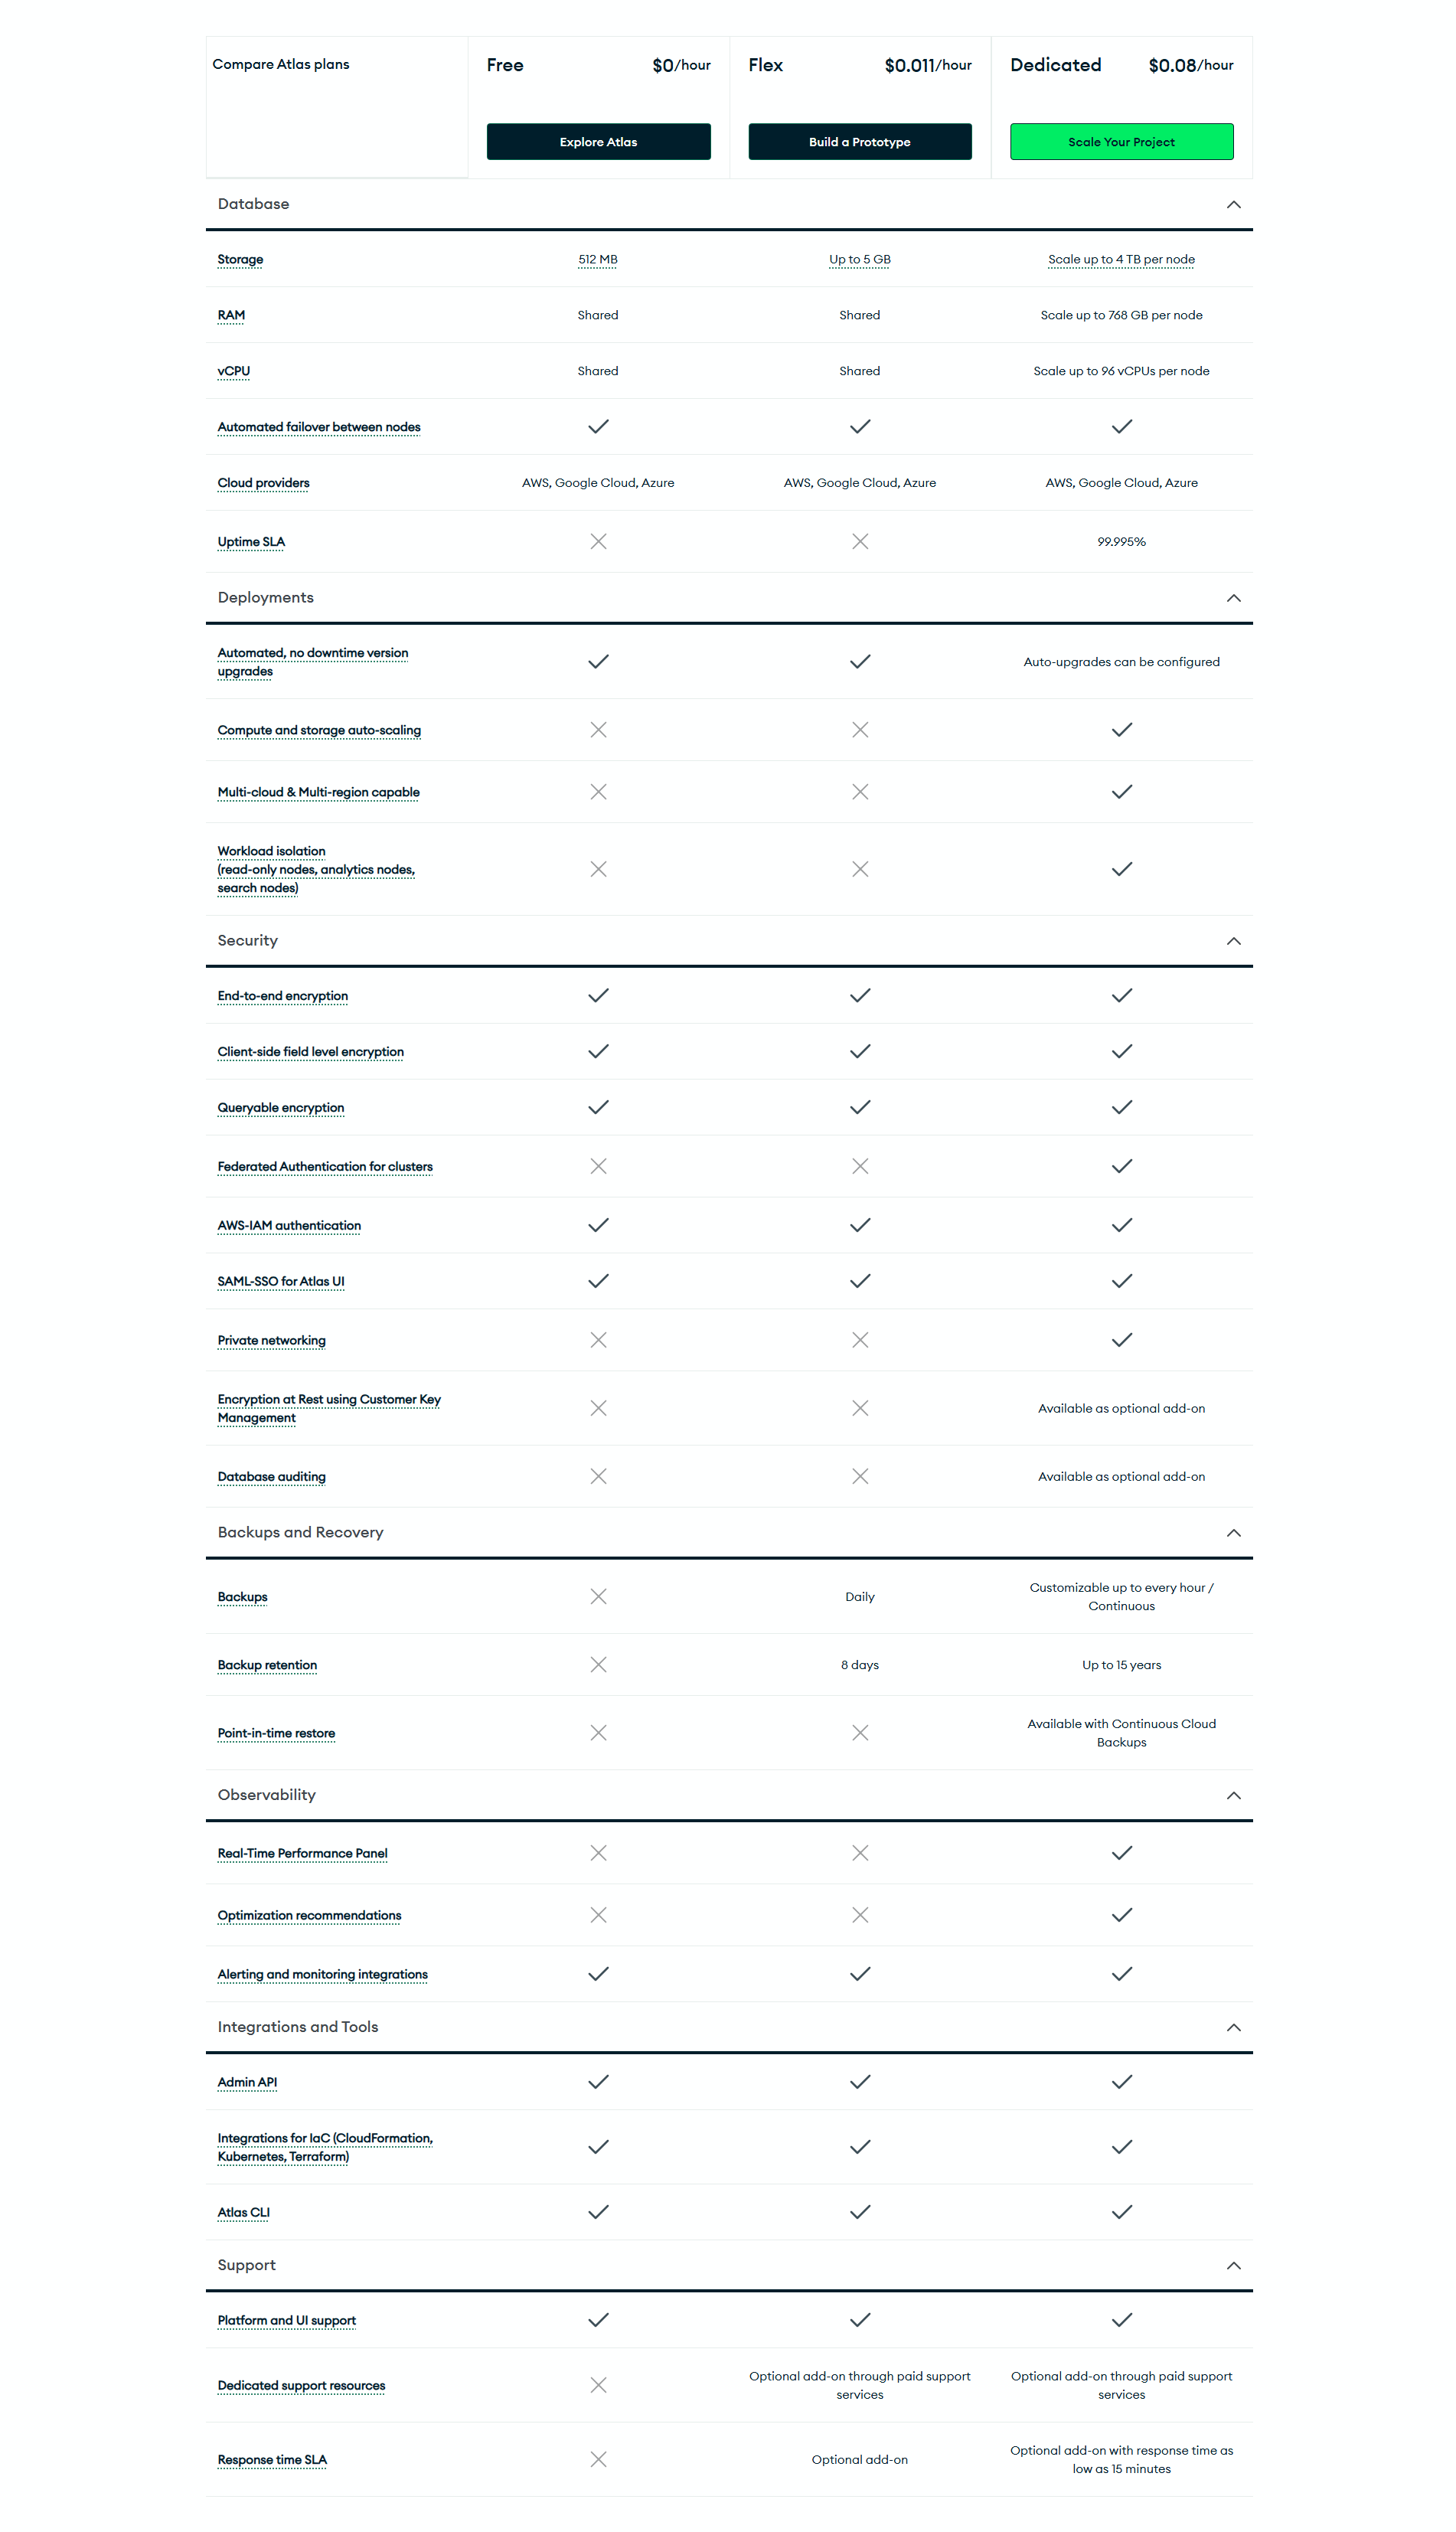

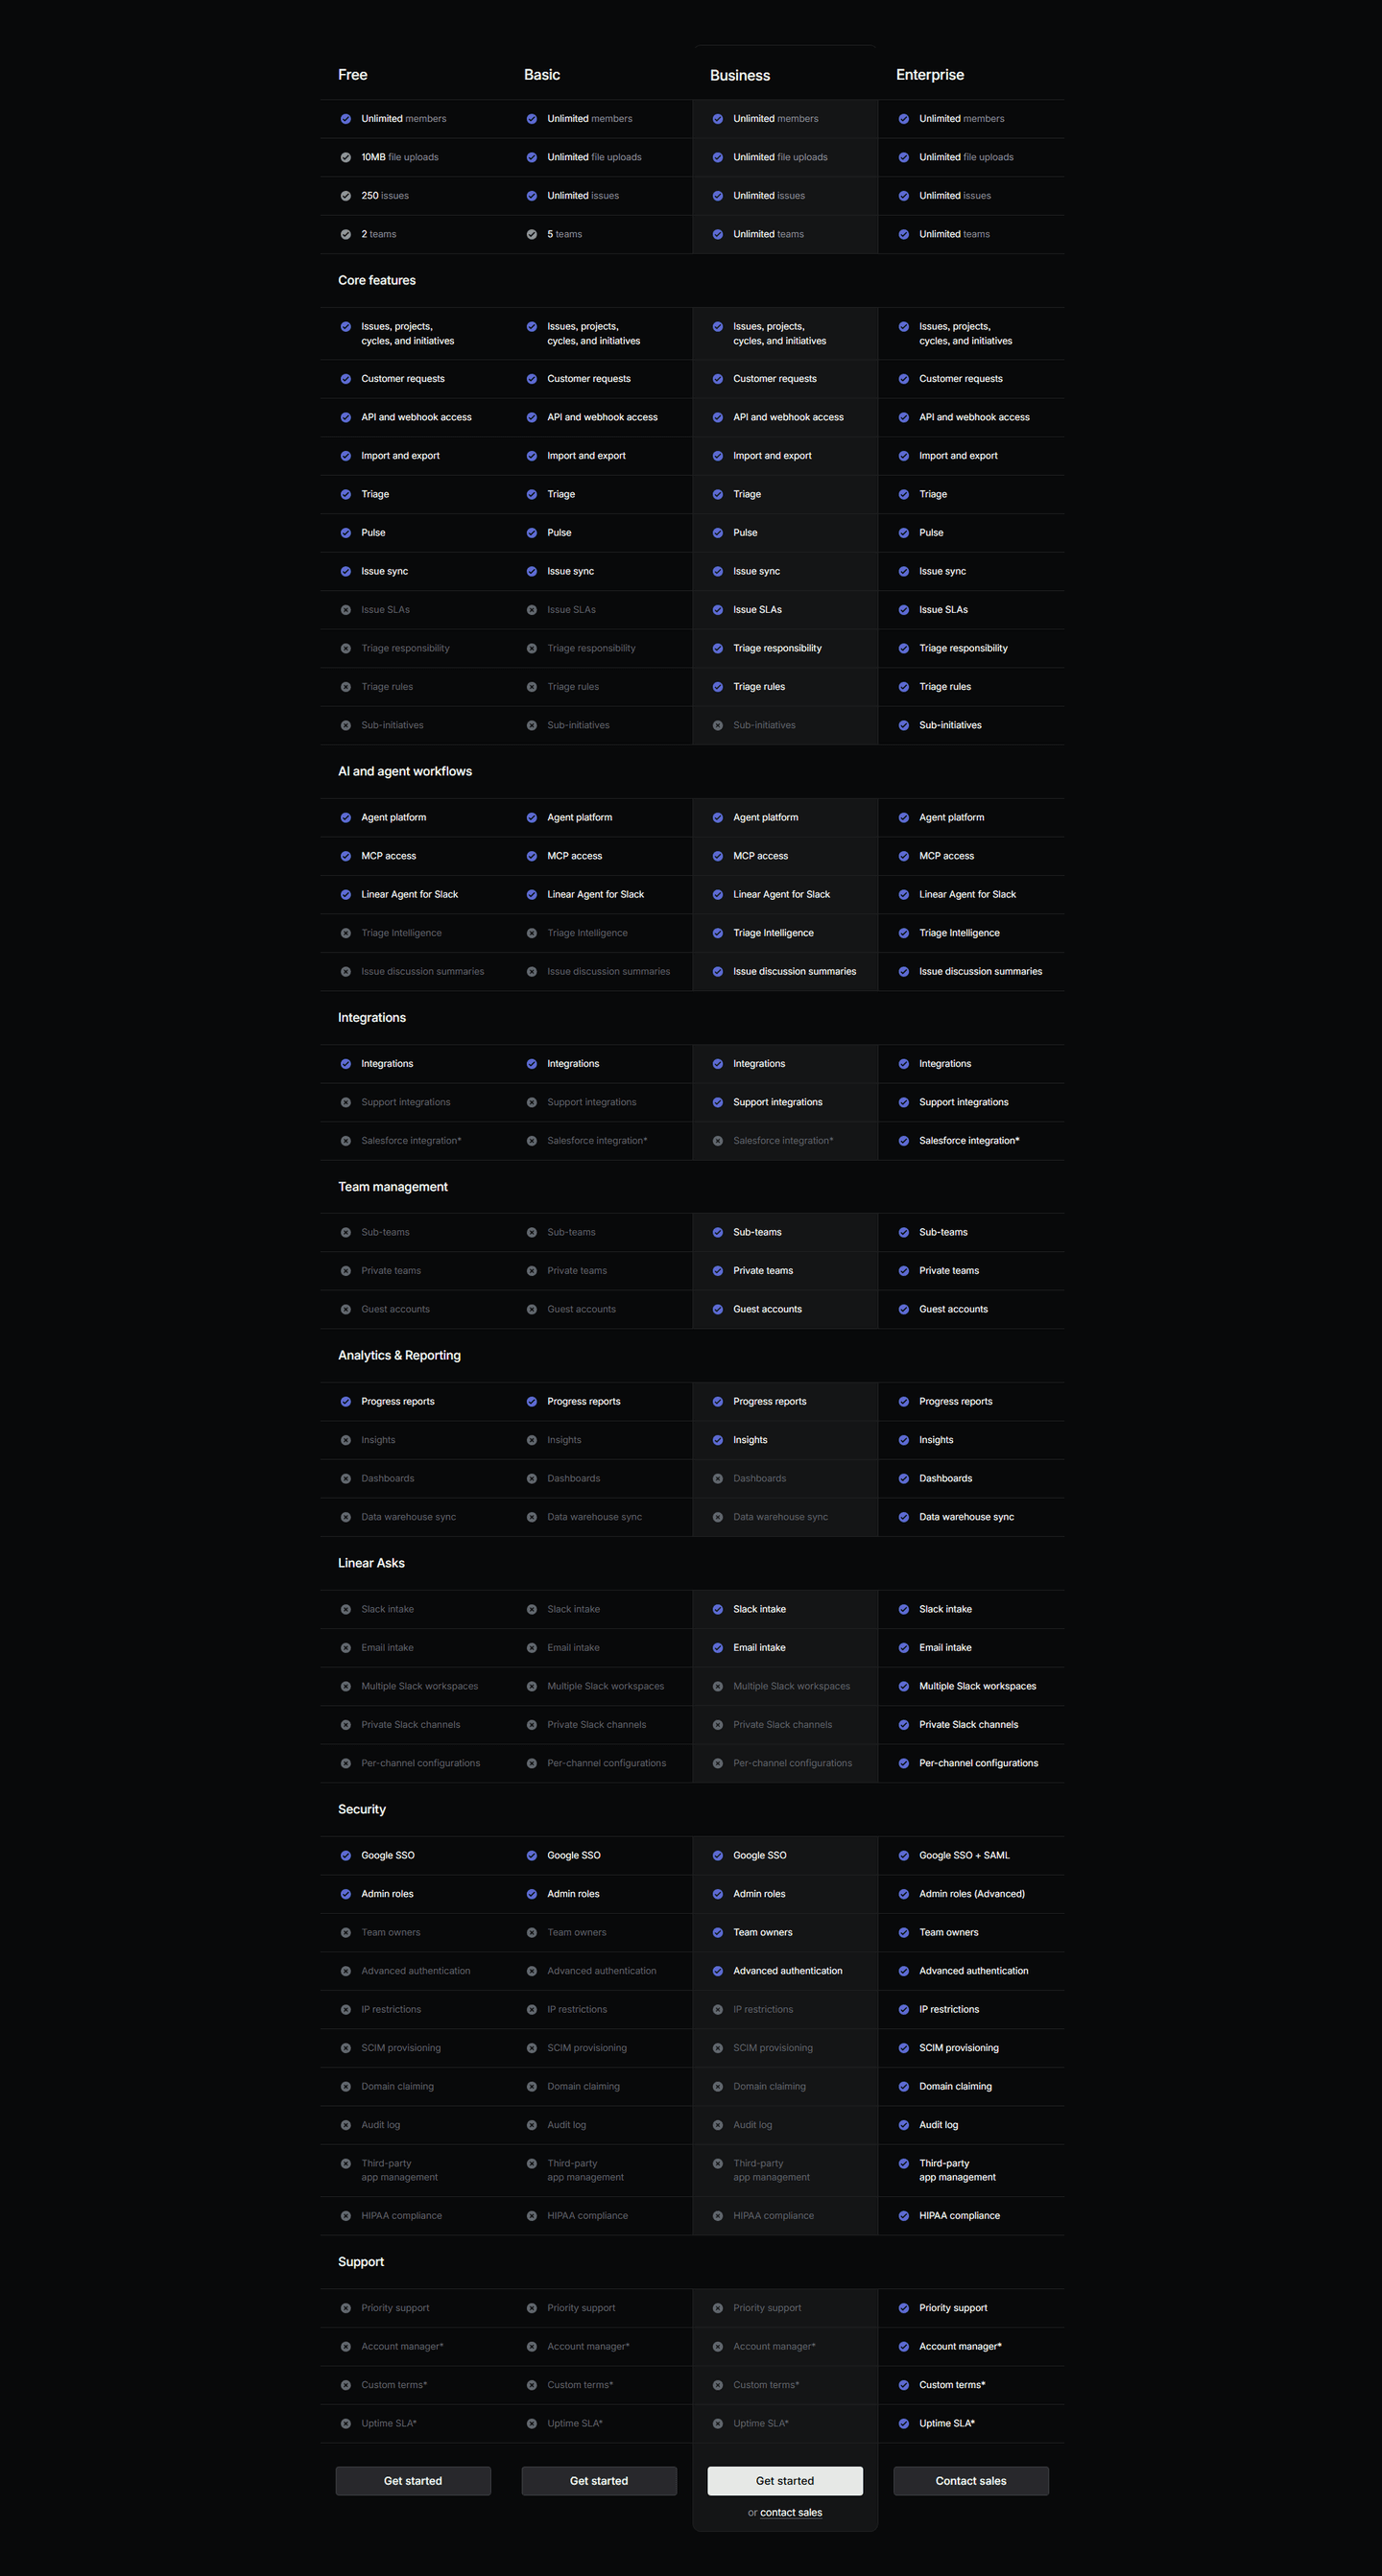
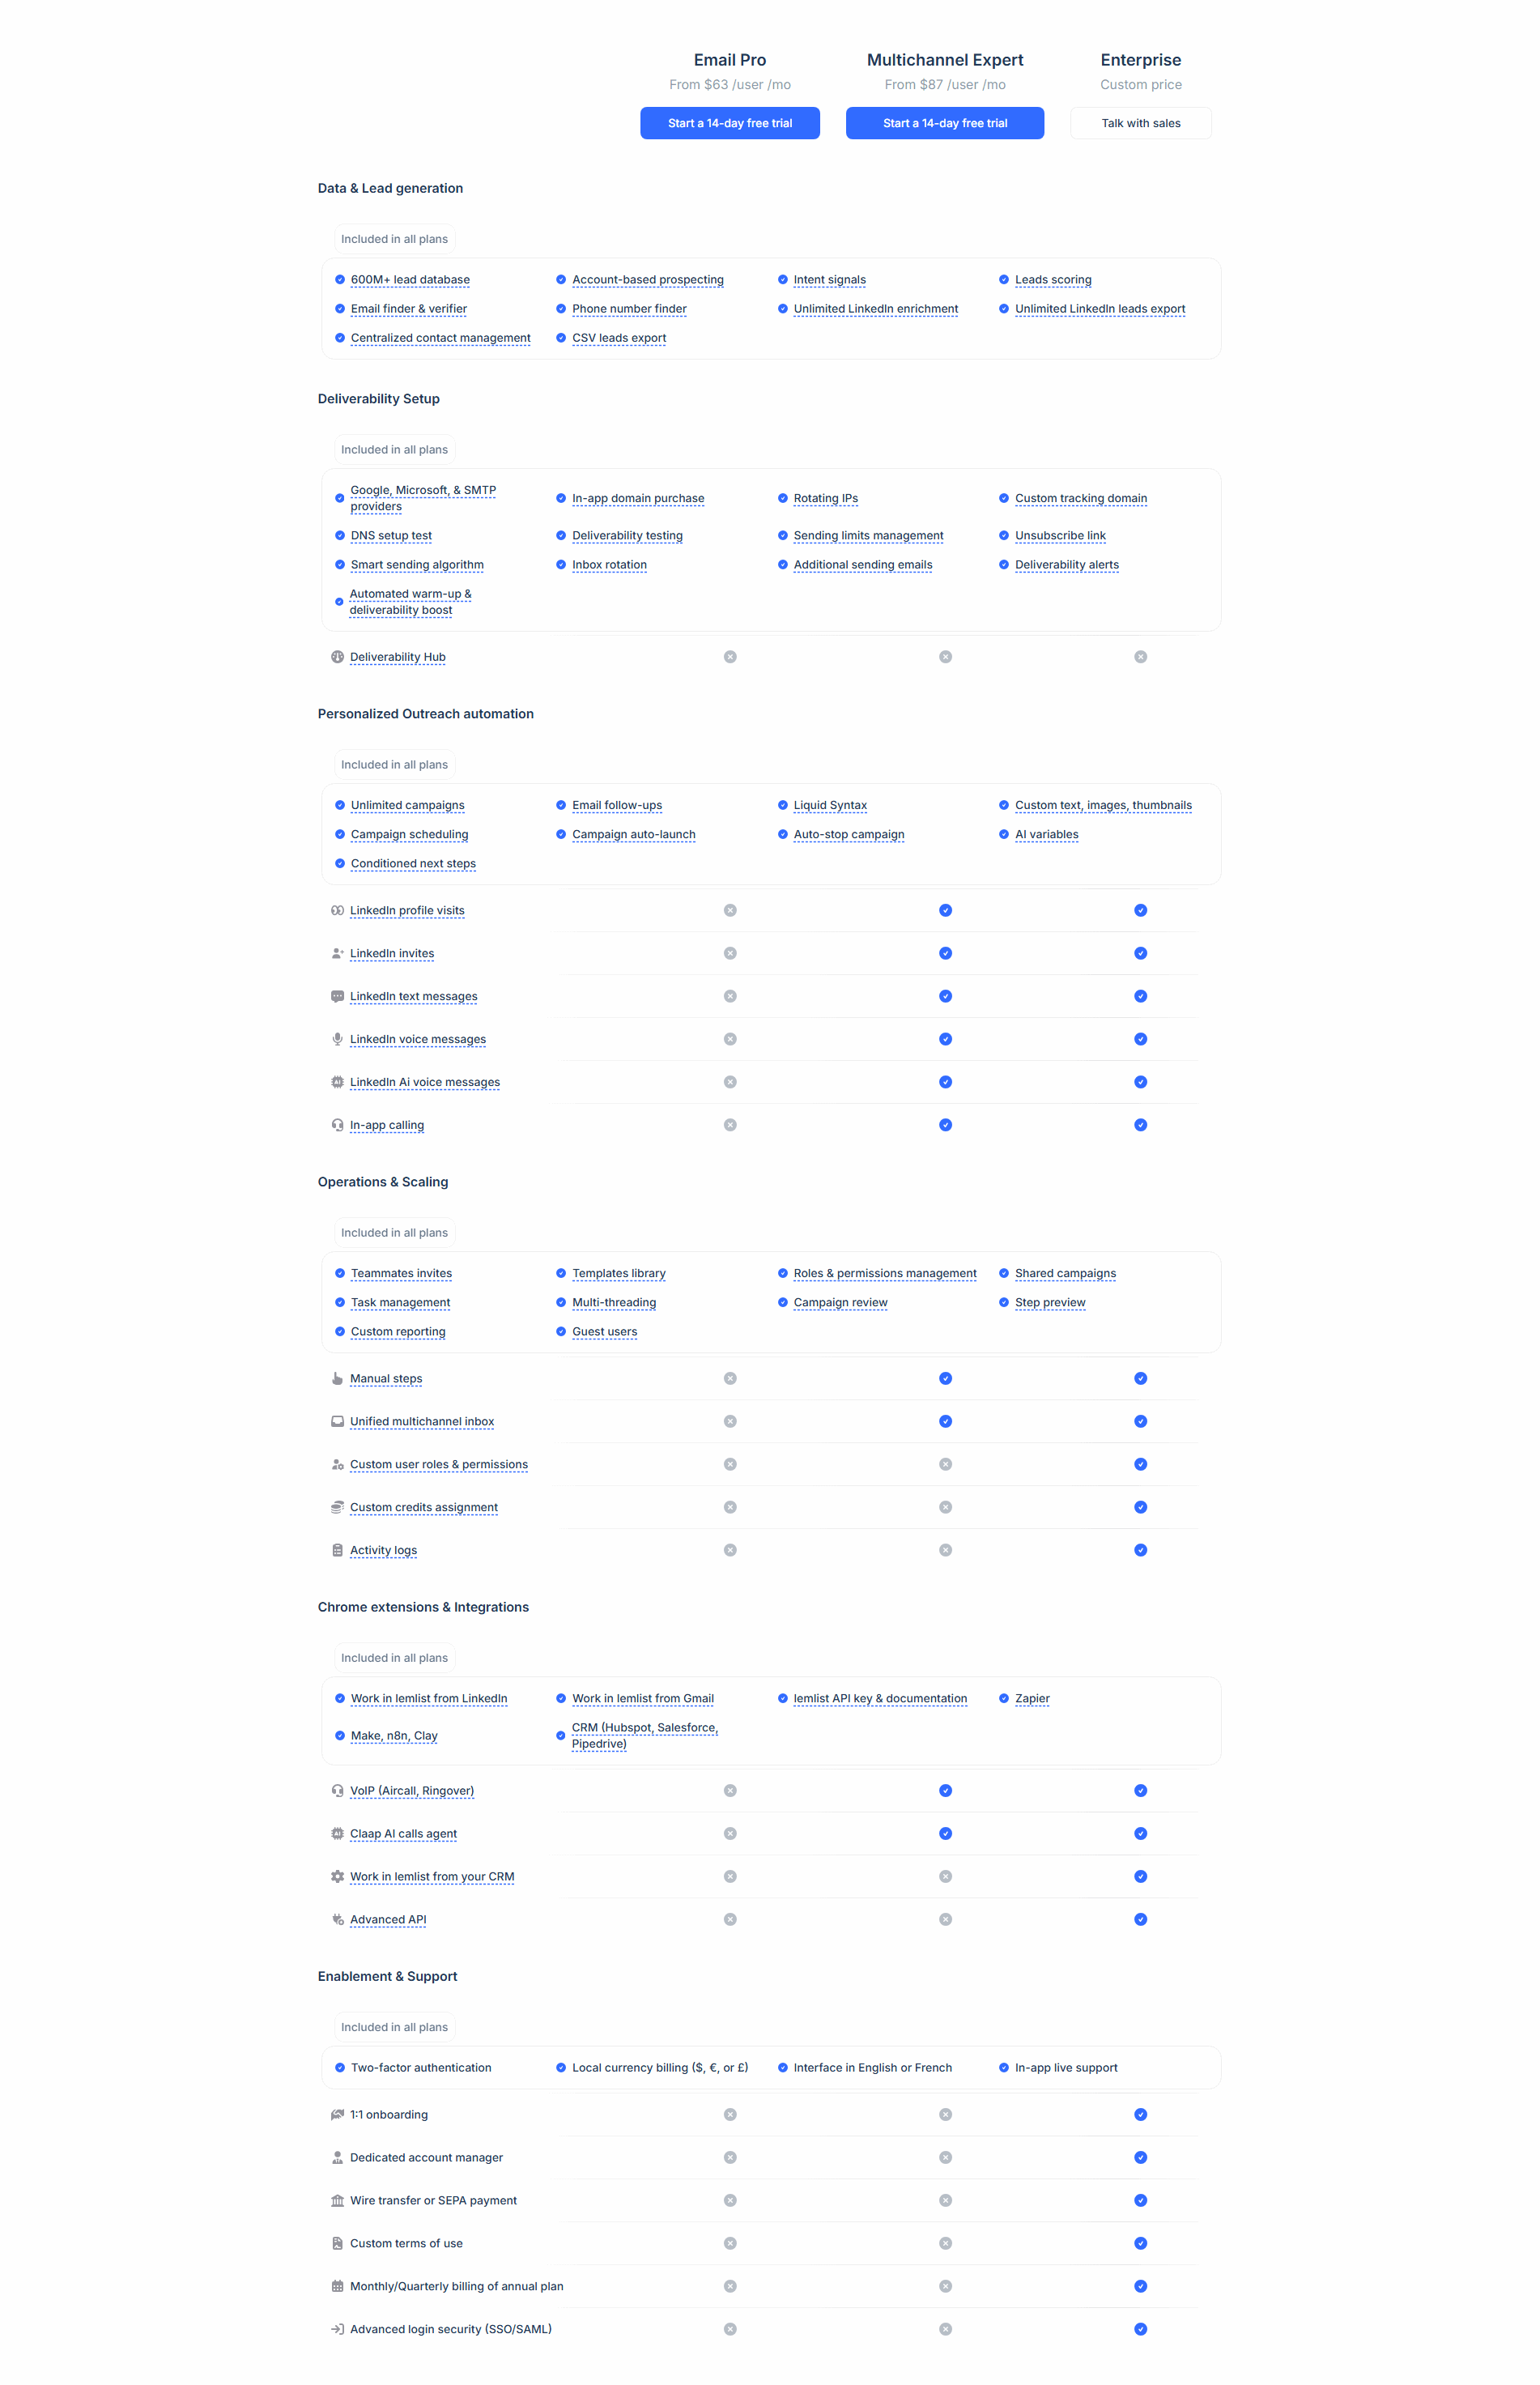

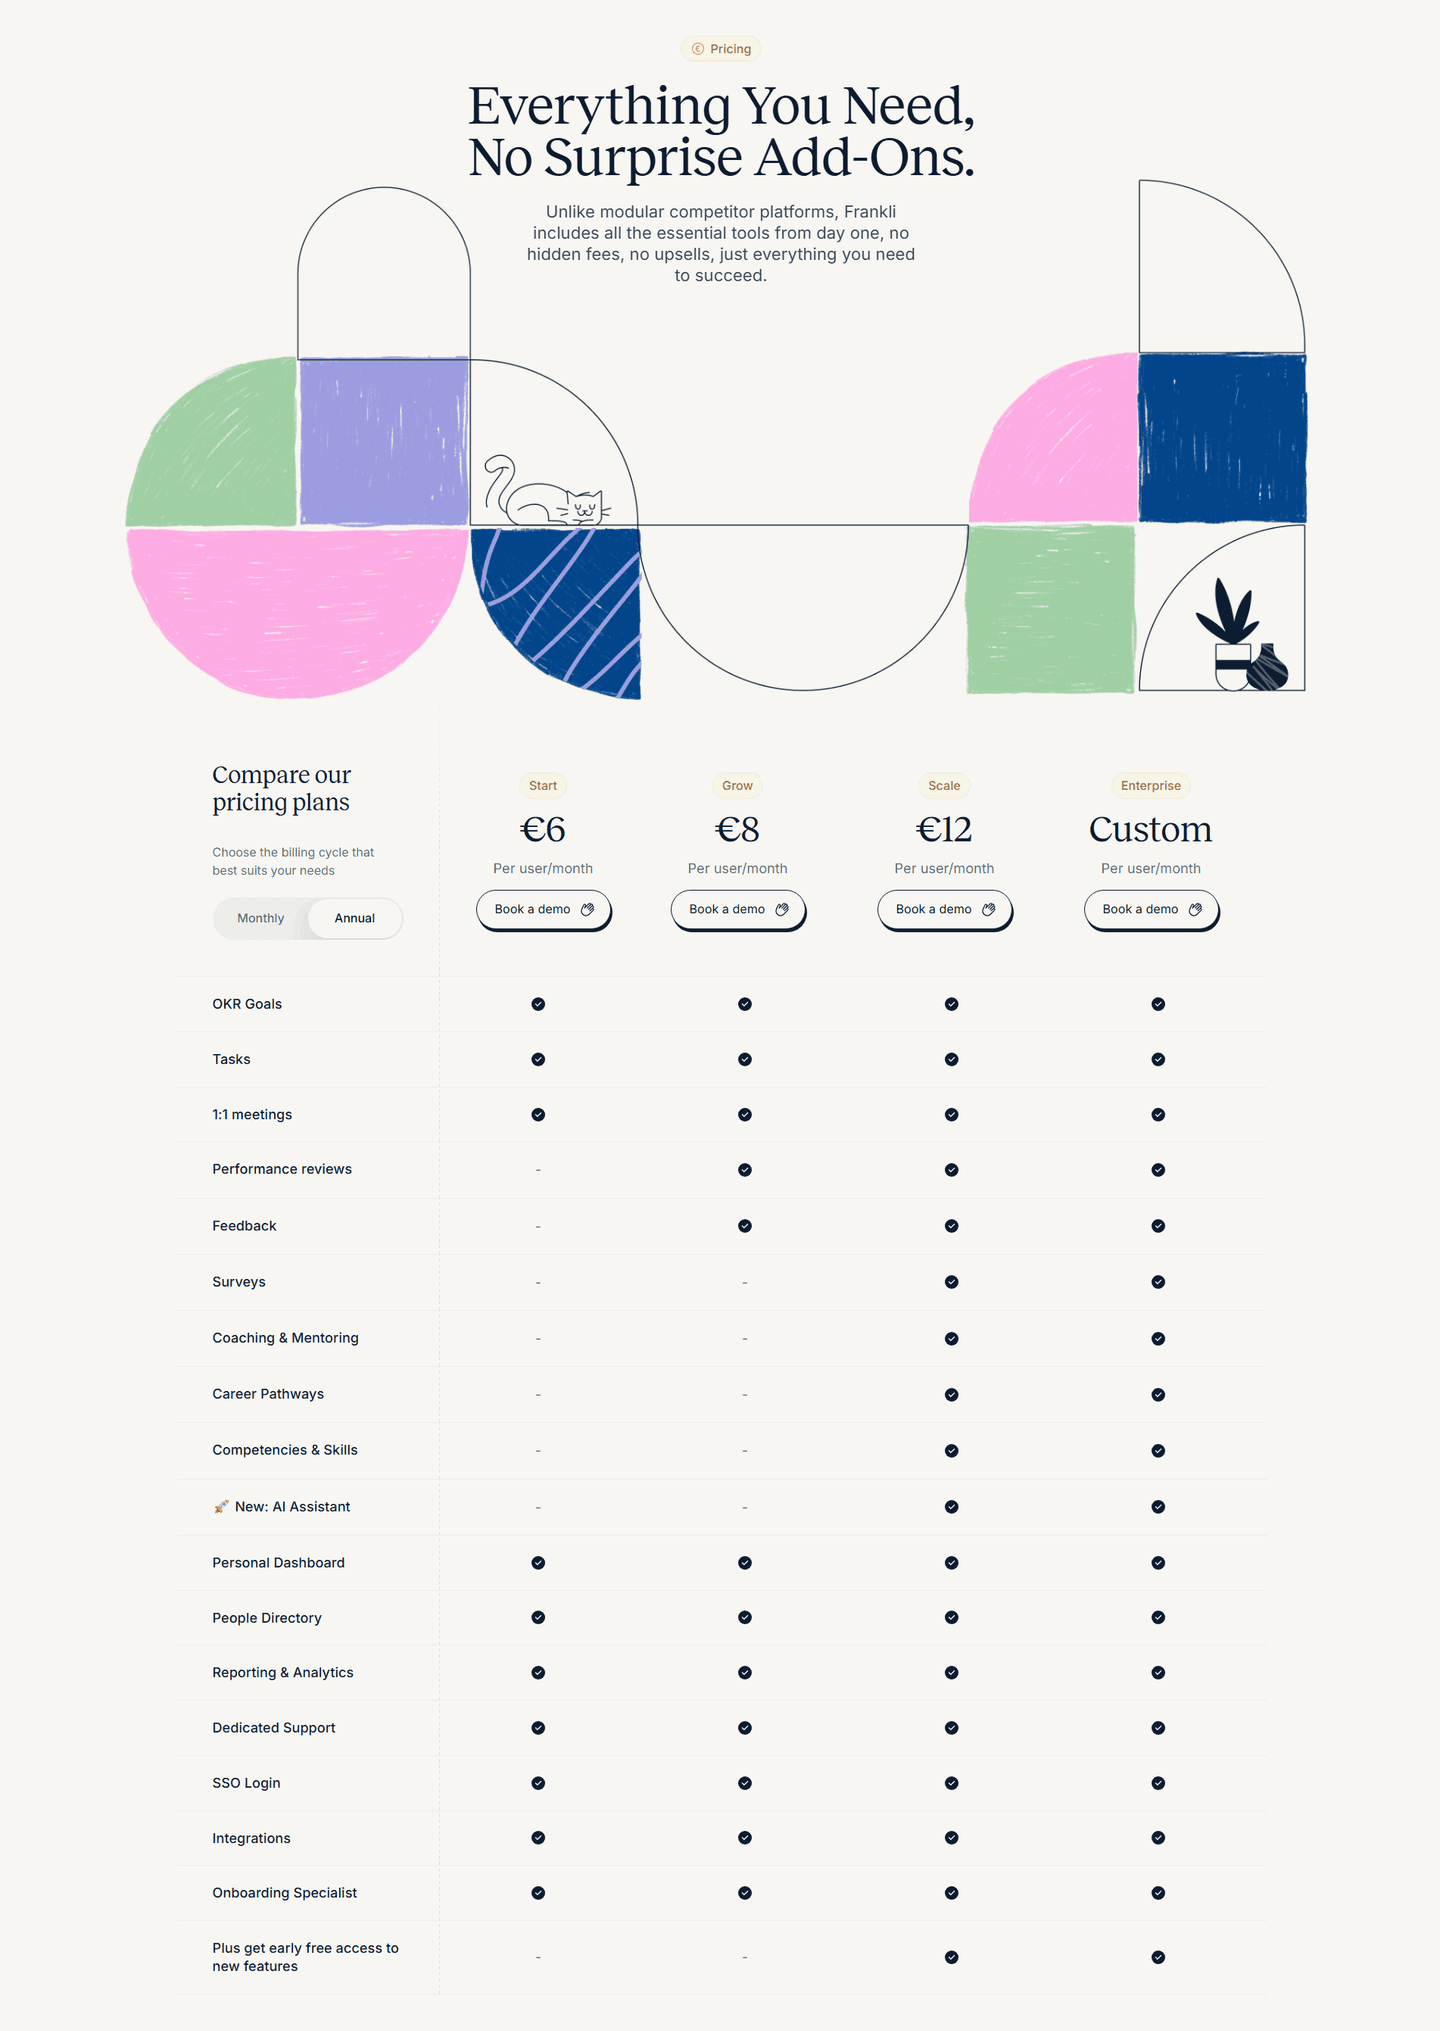


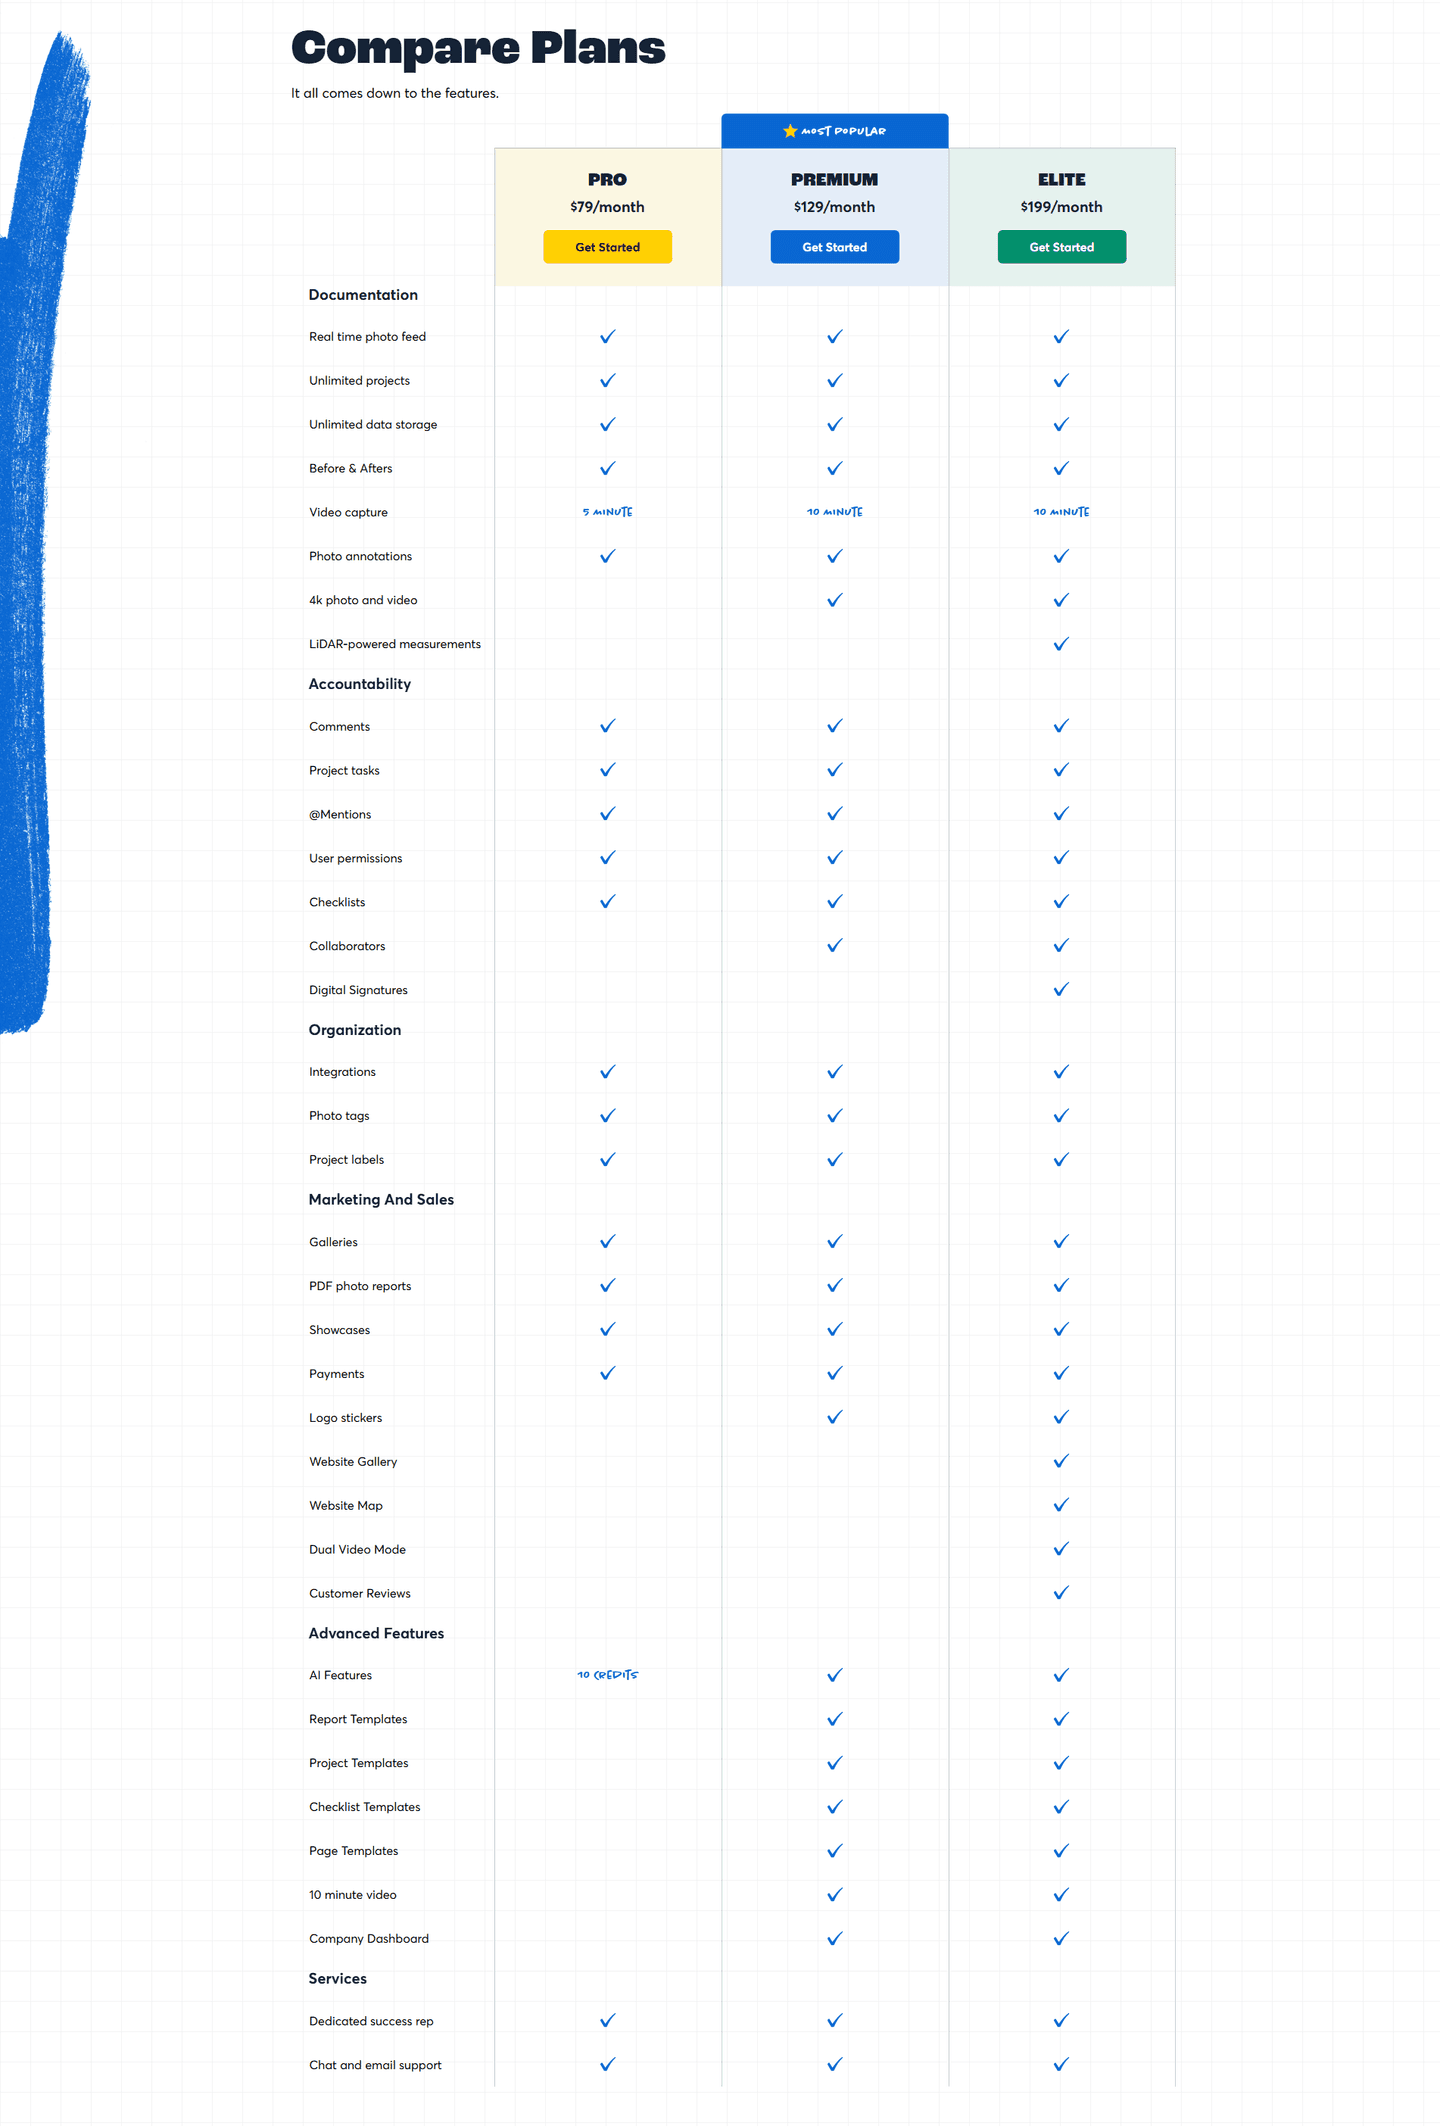
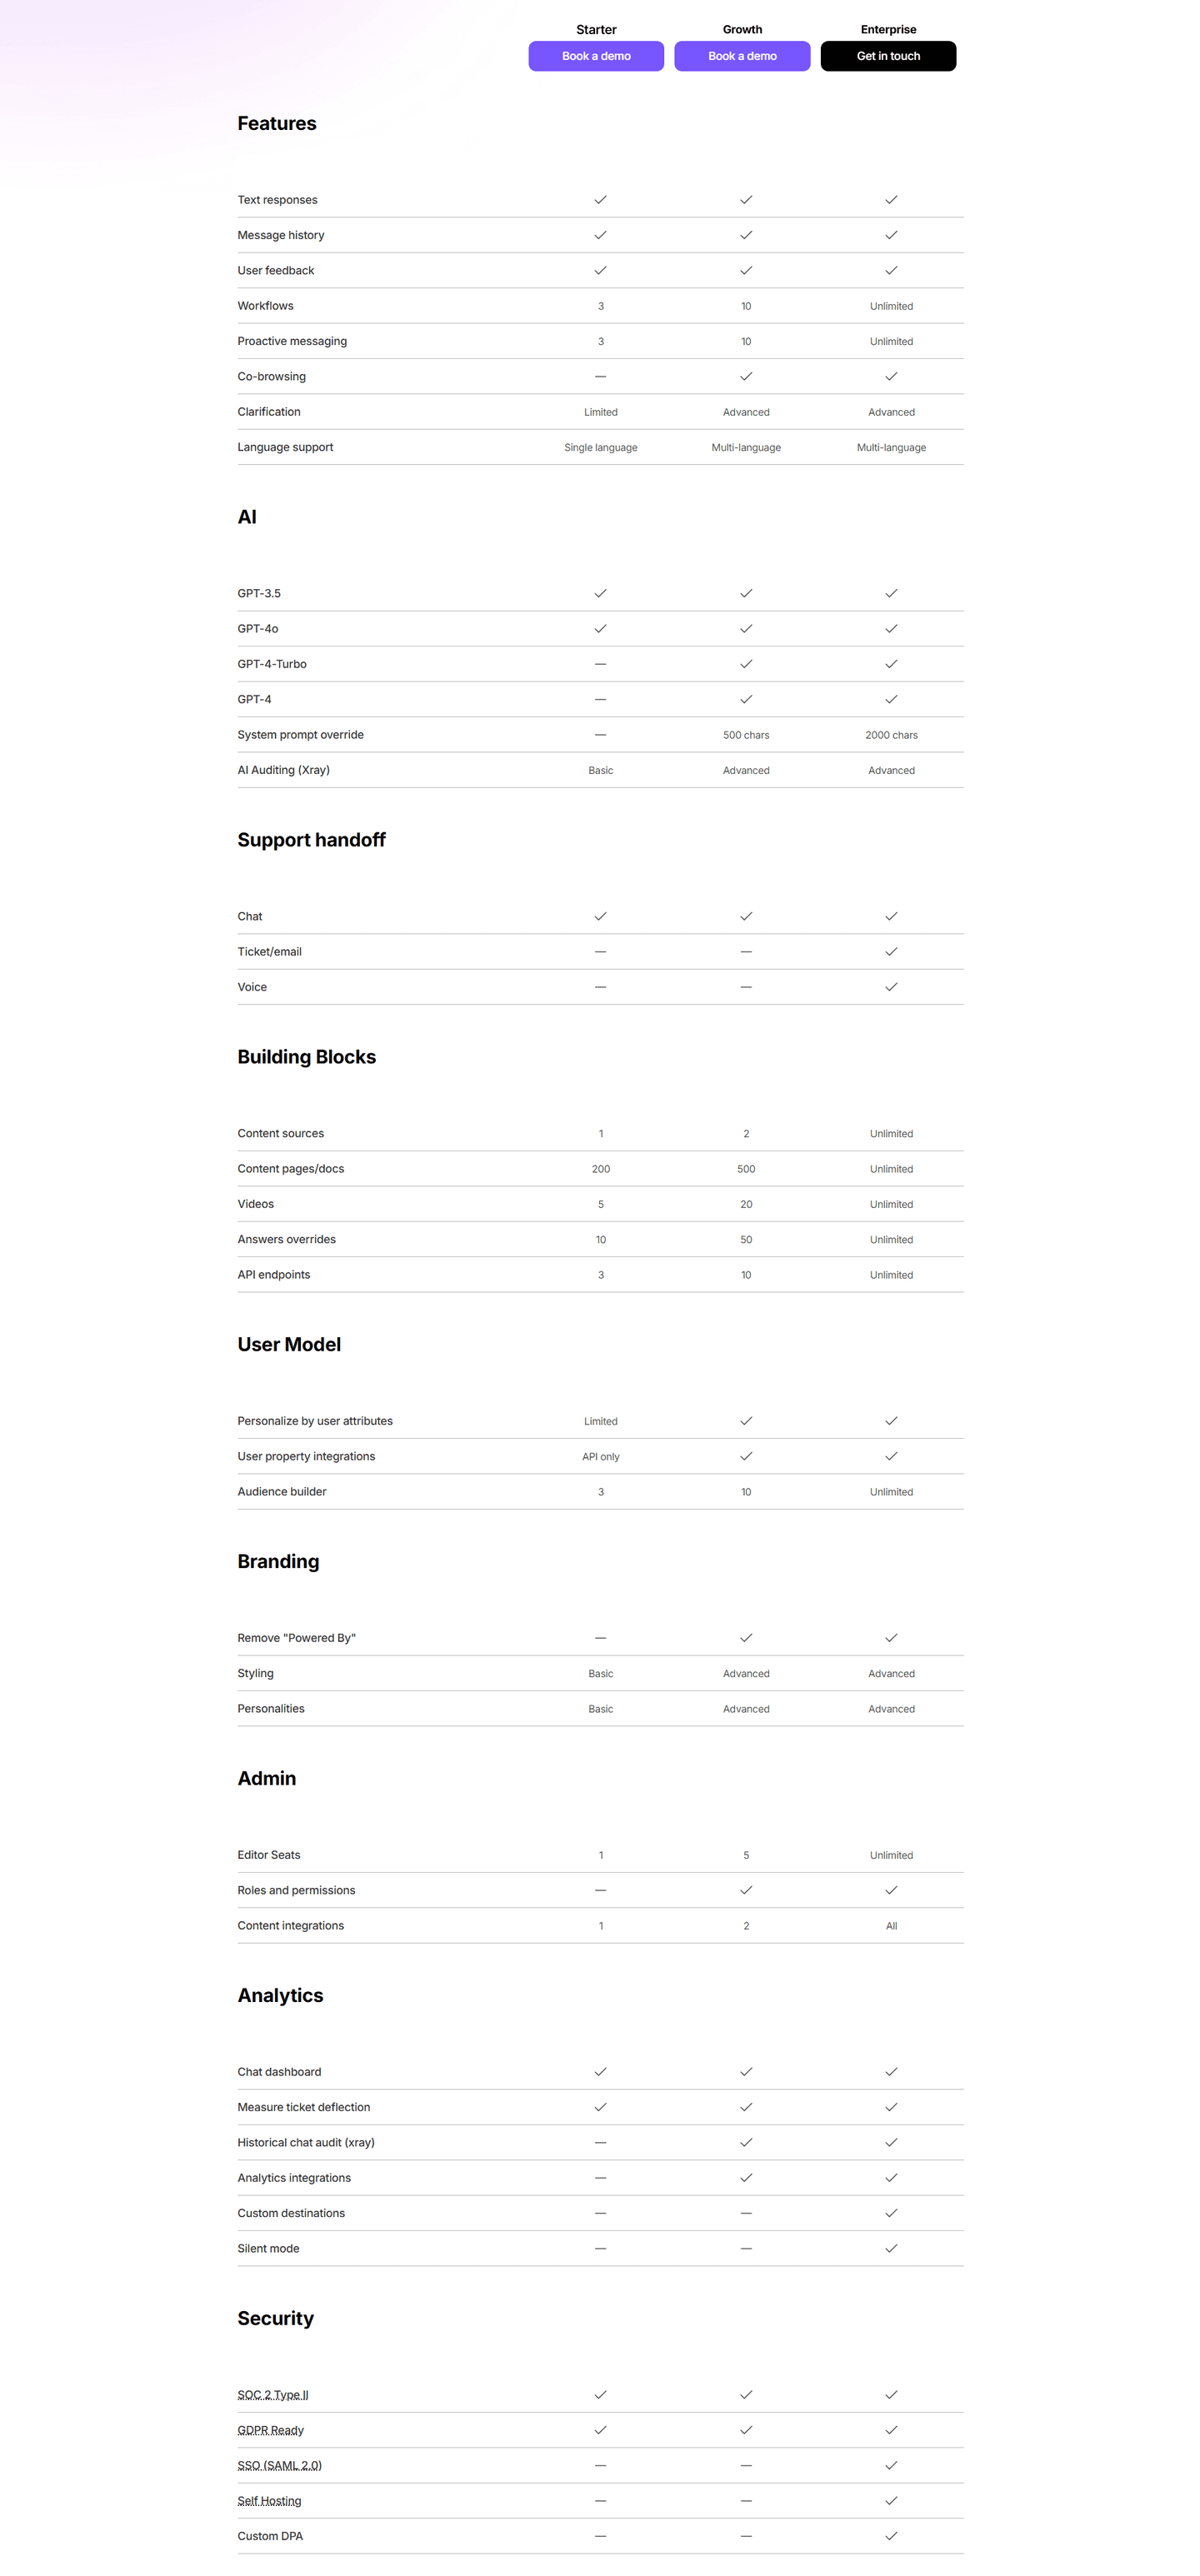
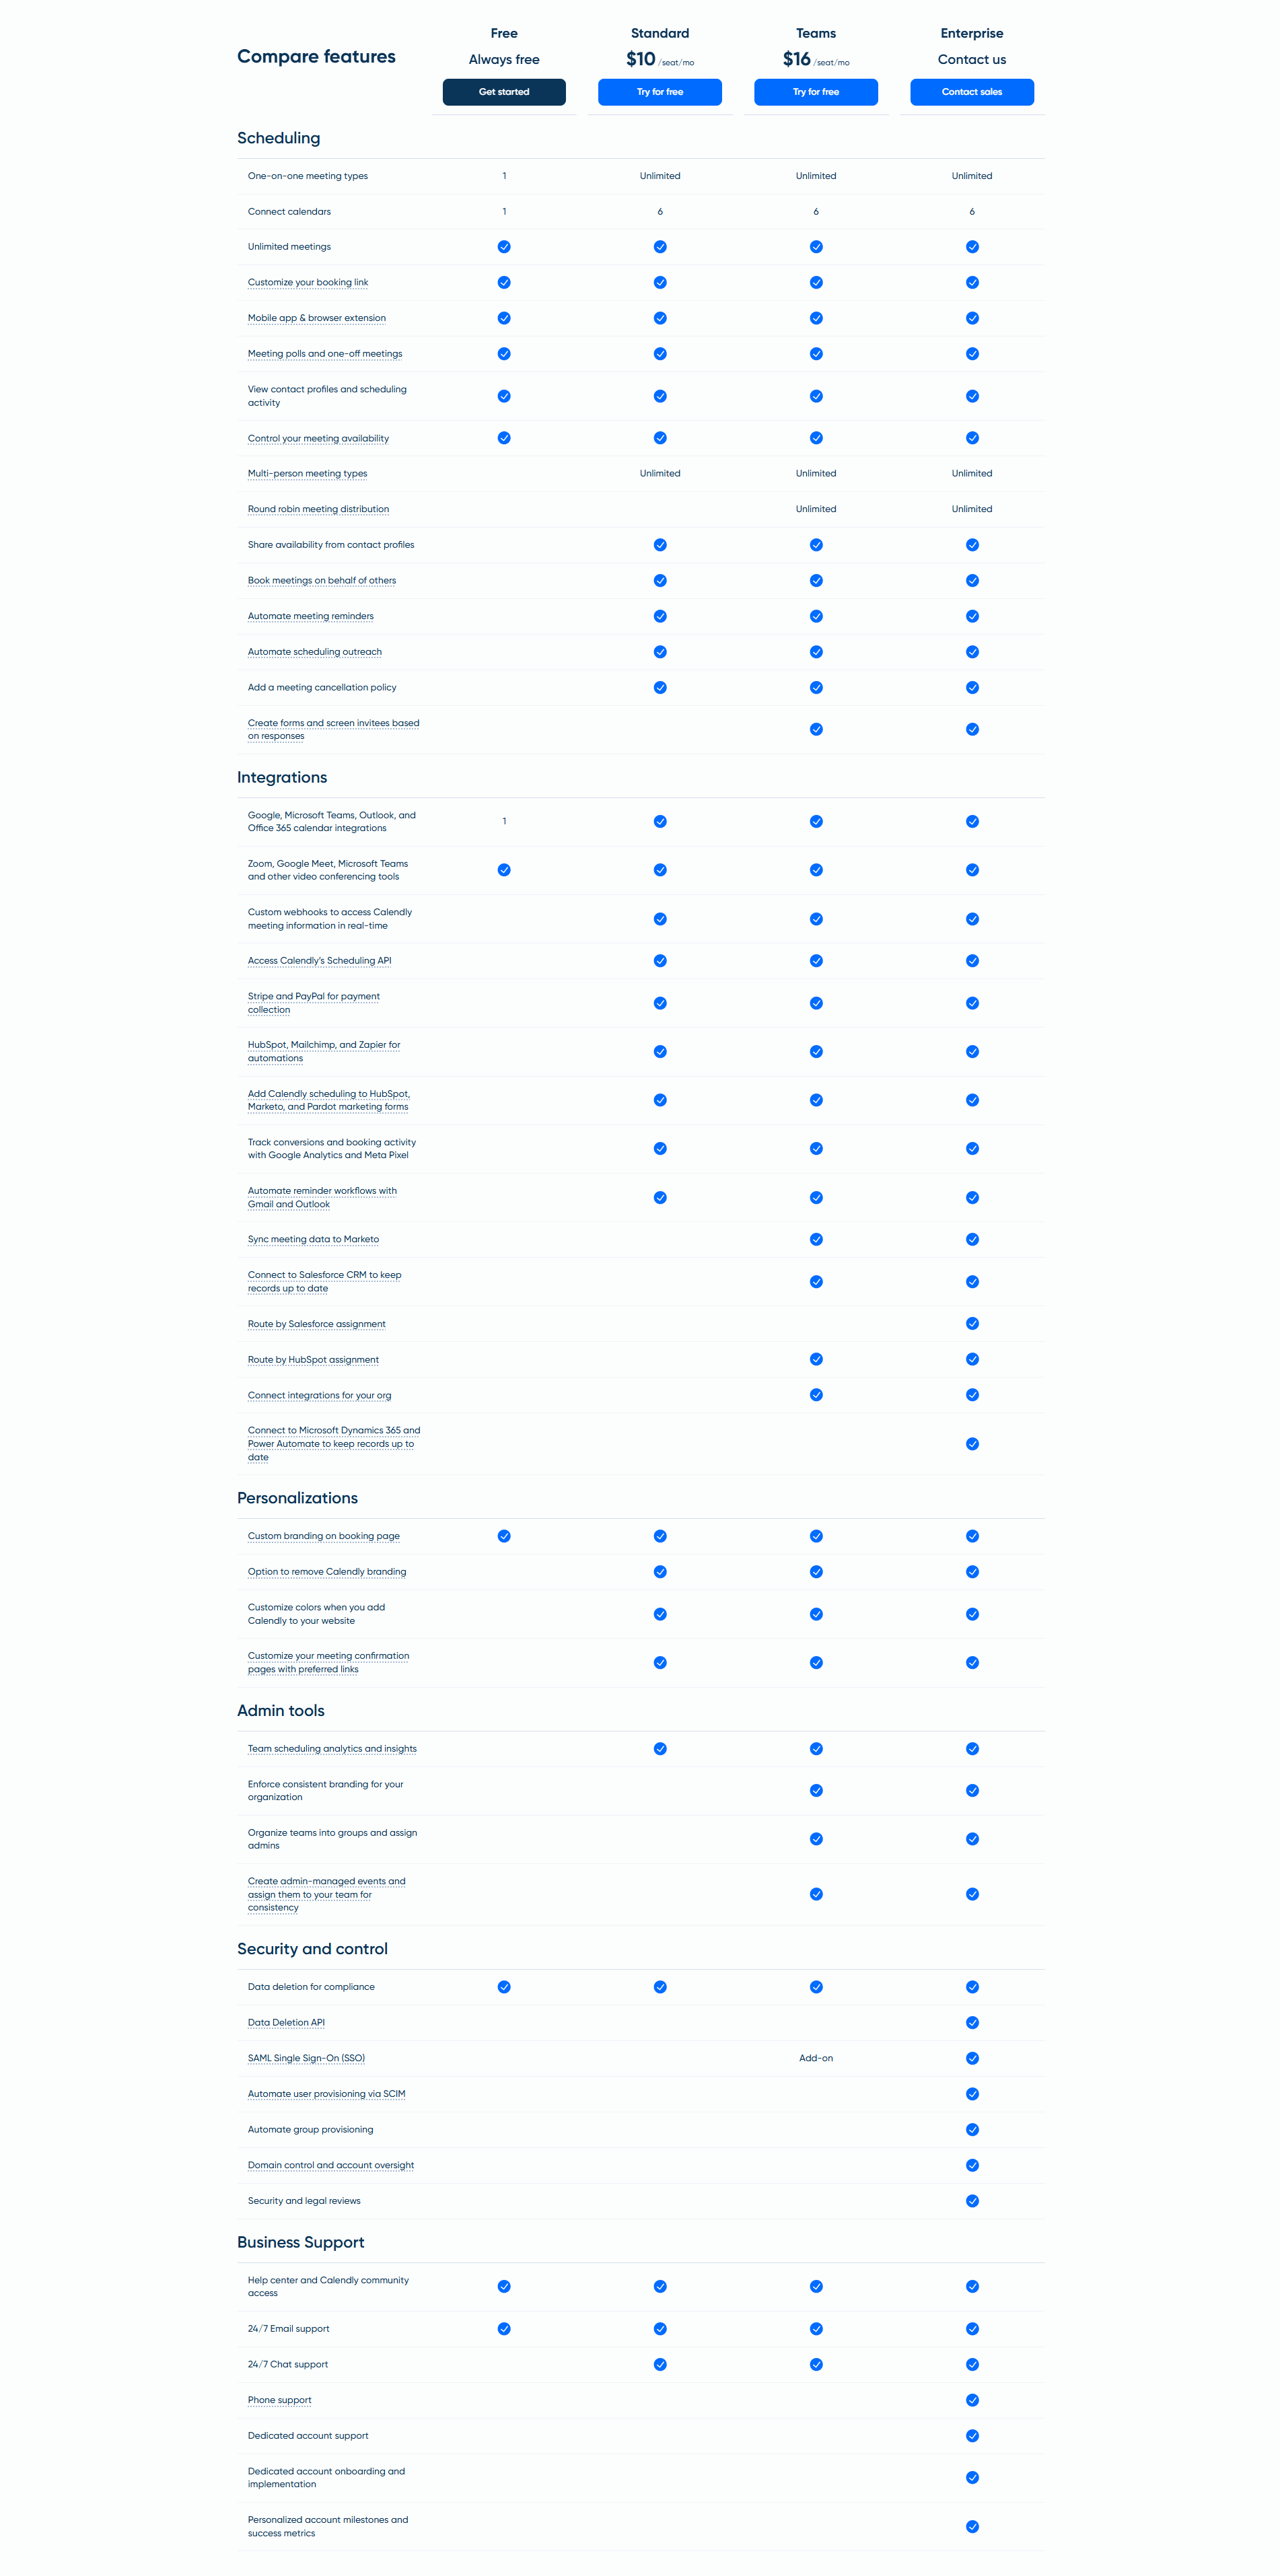
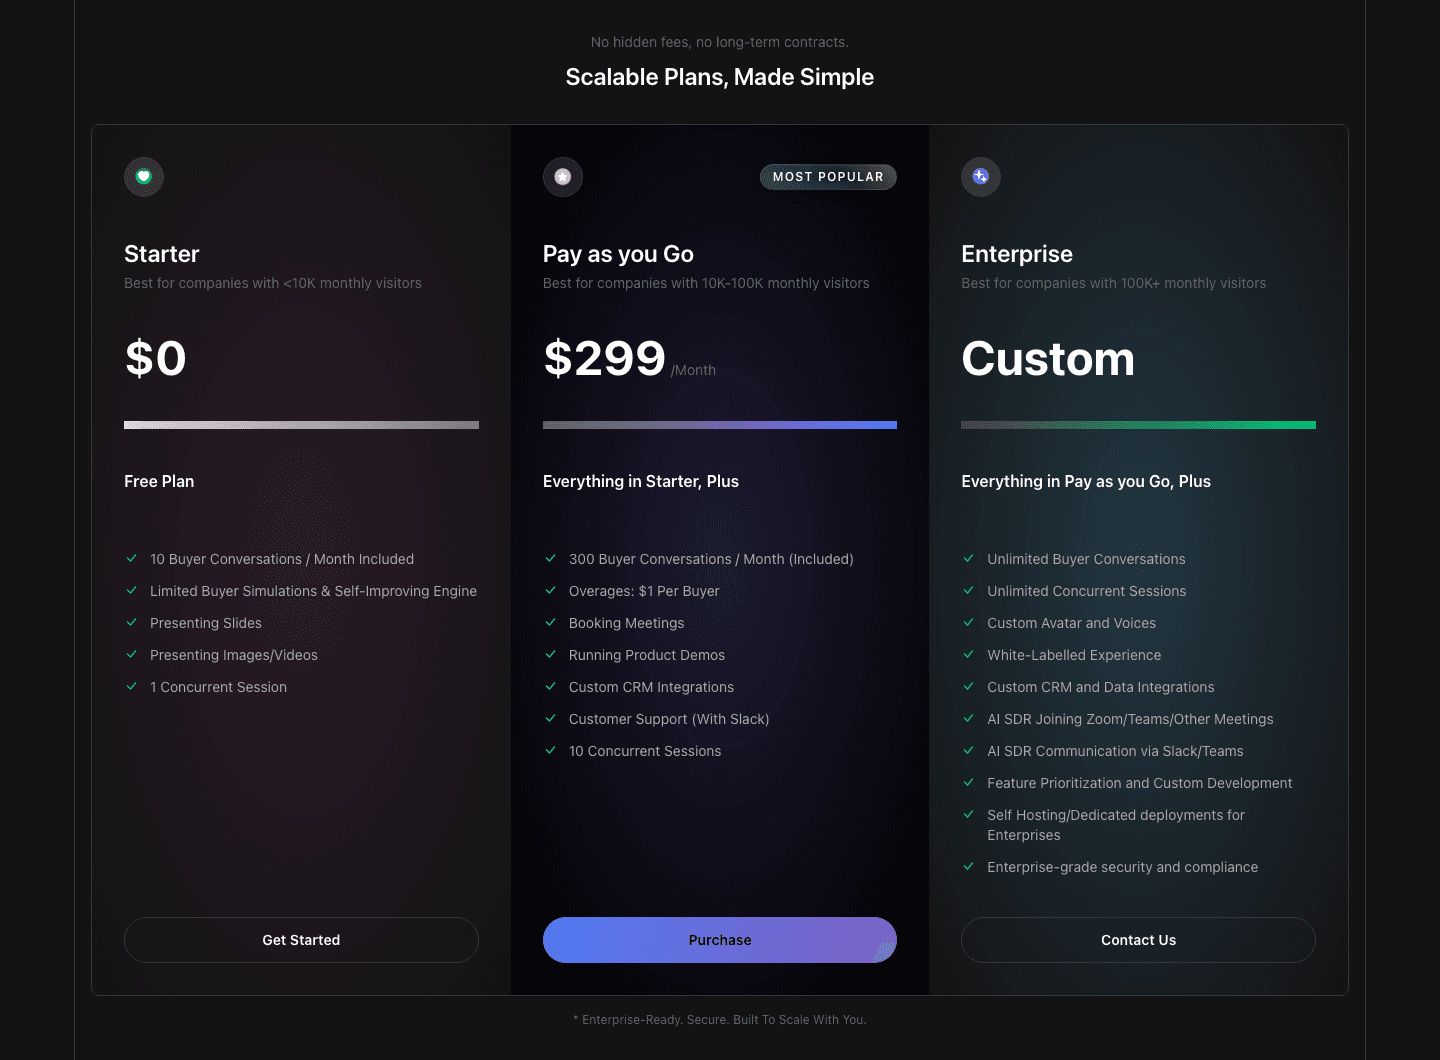
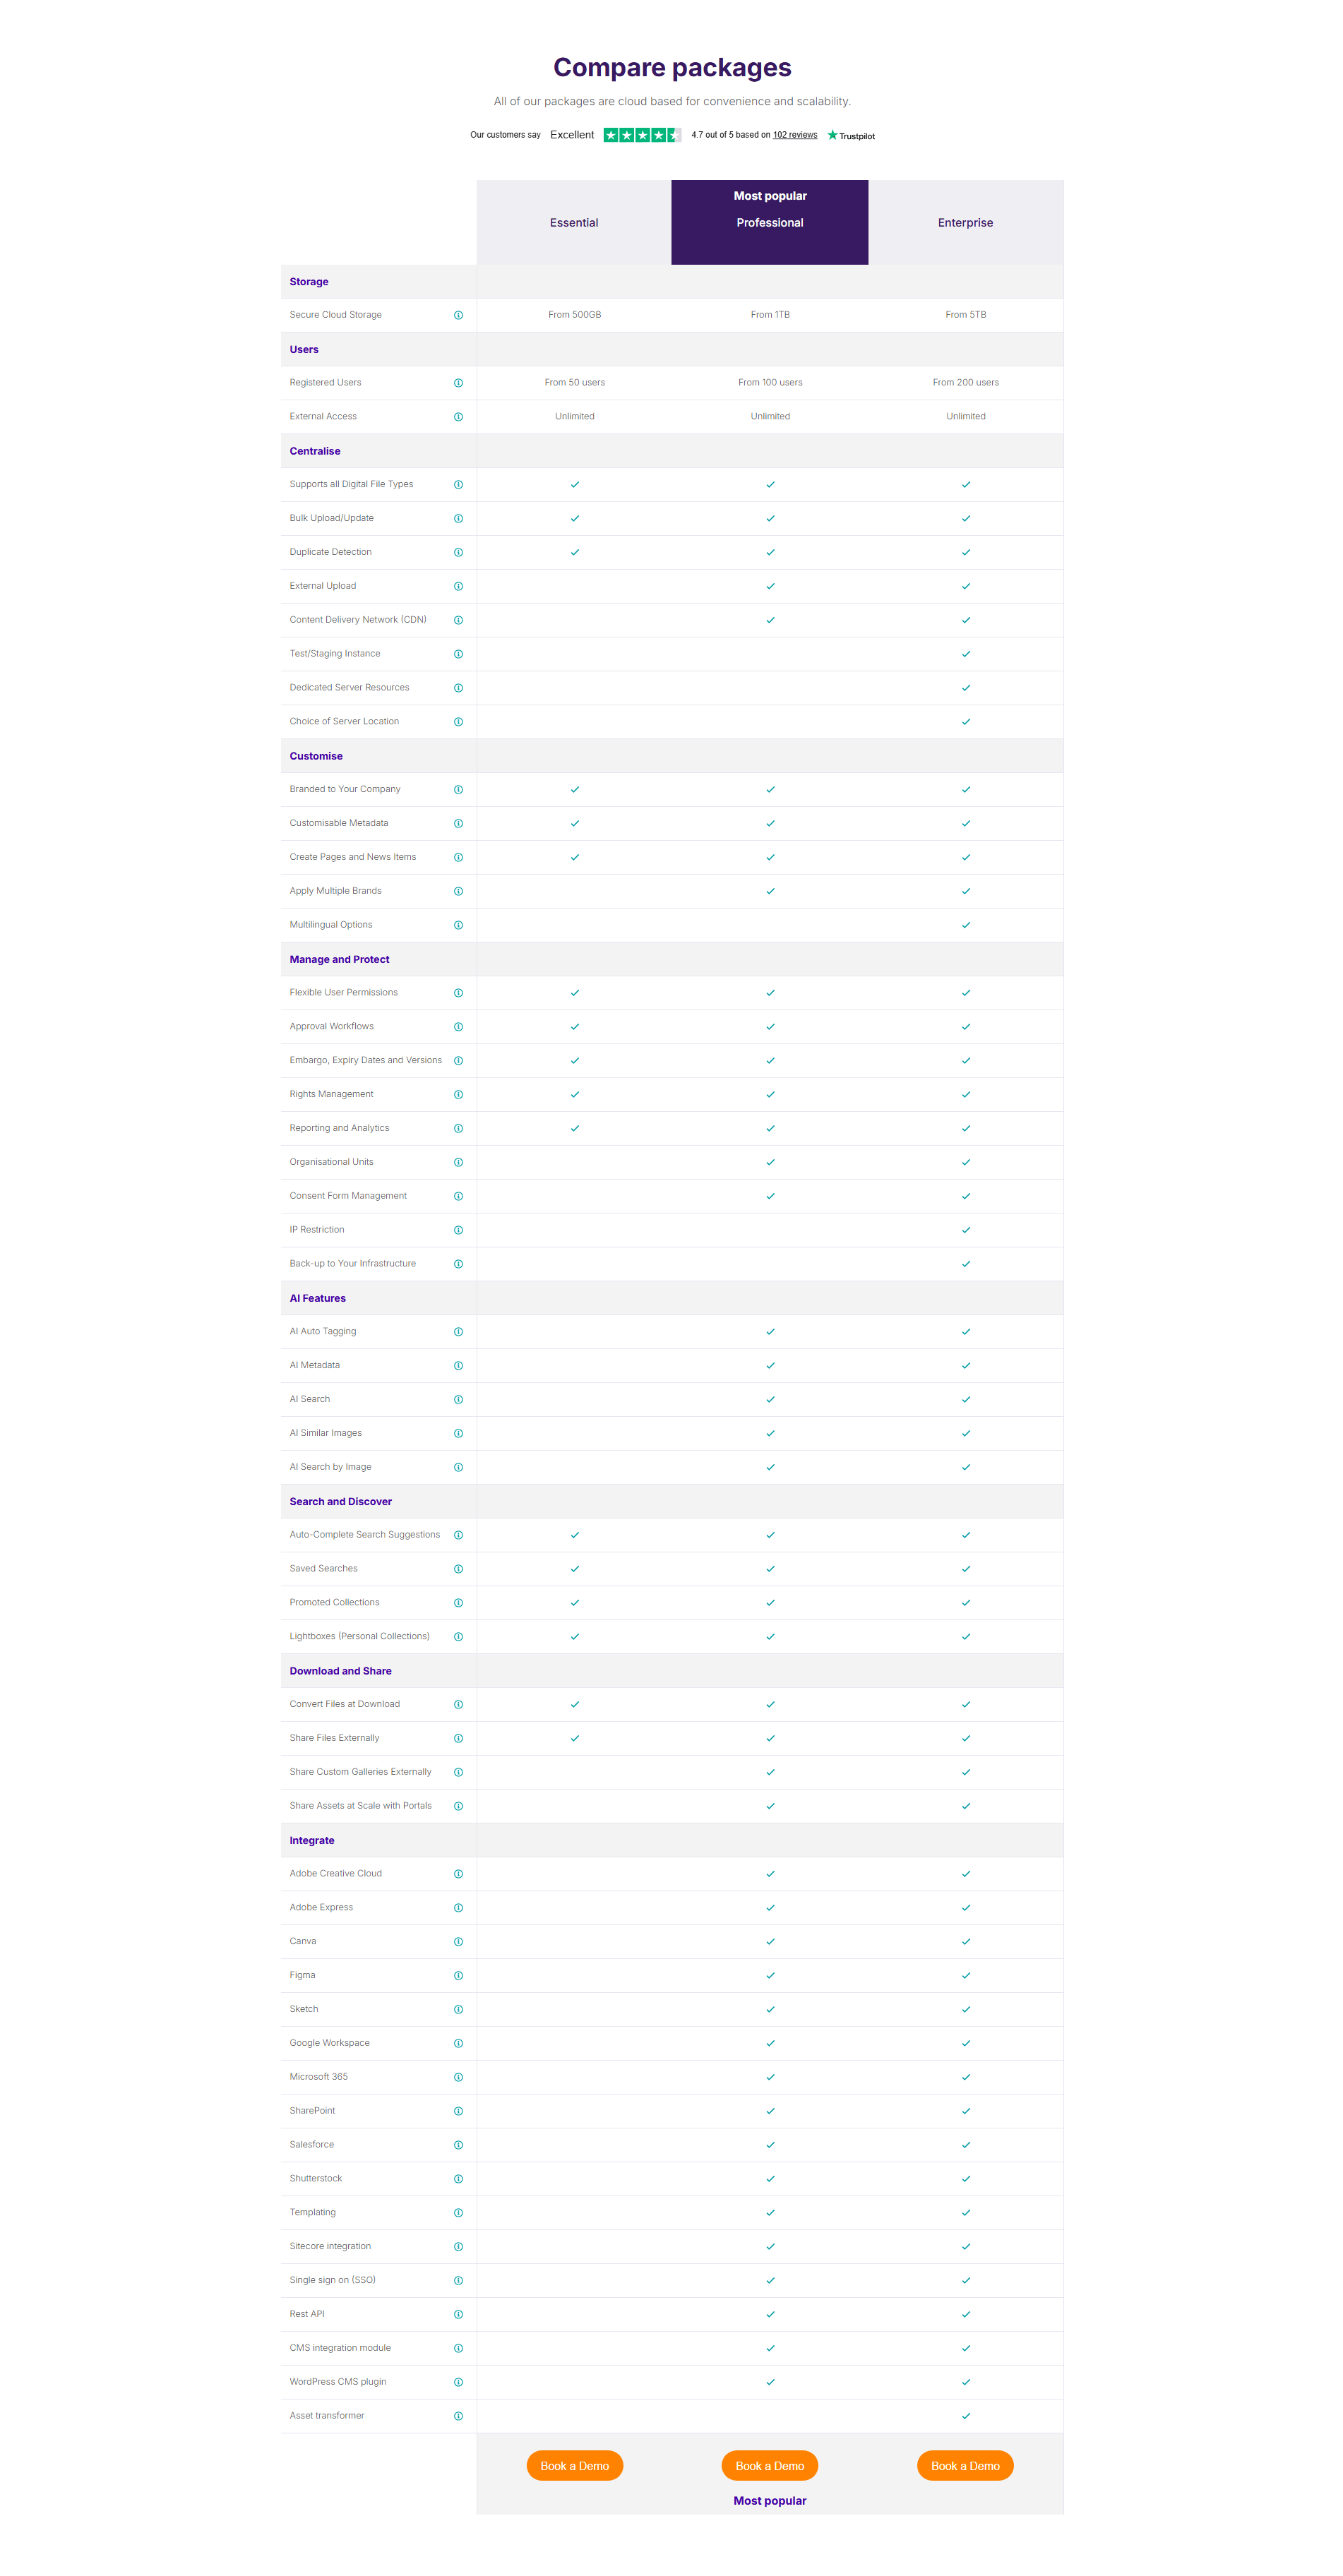
A pricing table puts your plans side by side, with the features each one includes, so a buyer can pick without asking sales. The pricing table examples above show how the best keep it readable.
What the best pricing tables do:
For a long table, keep the plan names visible while scrolling (sticky headers). Only 10% do it.
We checked the pricing tables in our library for the elements below. The lower the number, the fewer pages do it, and the bigger your edge when you add it.
Plan names stay visible while scrolling the feature matrix, keeps visitors oriented
Hover for feature details, clarification without cluttering the table
CTA buttons at the top and/or bottom of the table, conversion access points
Features grouped by category (Core, Advanced, Enterprise), organized comparison
Easy to scan rows and columns with clear checkmarks and labels, quick evaluation
| Element | What it means | Use it | Type |
|---|---|---|---|
| Sticky headers | Plan names stay visible while scrolling the feature matrix, keeps visitors oriented | 10% | Big opportunity |
| Tooltip explanations | Hover for feature details, clarification without cluttering the table | 13% | Big opportunity |
| CTA row | CTA buttons at the top and/or bottom of the table, conversion access points | 46% | Opportunity |
| Highlight differences | Key differentiators visually emphasized, guides the upgrade decision | 59% | Common |
| Category grouping | Features grouped by category (Core, Advanced, Enterprise), organized comparison | 87% | Table stakes |
| Feature matrix clarity | Easy to scan rows and columns with clear checkmarks and labels, quick evaluation | 92% | Table stakes |
Sticky headers are the rarest element. On a table with 15 or more feature rows, their absence is a real problem: the visitor scrolls, loses track of which column is which plan, and gives up comparing.
We check every pricing table against a weighted checklist, from the page itself and its screenshot:
Highlighted differences and a row of buttons weigh the most, because the highest-scoring tables lean on them. Sections flagged best-in-class are picked by hand from the highest scores.
Interactive quiz
Is the feature comparison easy to scan with clear checkmarks?
Clean rows and columns with clear labels, quick evaluation
6 pricing tables in our library are flagged best-in-class. They do four things together:
Administrate and PayFit do all four.
100/100The weakest pricing tables are not unreadable. Most have clean alignment and checkmarks, then stop. 41% show three identical columns with no recommended plan, so the visitor compares row by row. 54% have no button below the features, so after reading 20 rows the visitor has to scroll back up.
The fix is not a redesign. Add a "Recommended" badge to one plan, and repeat the button at the bottom of the table.
Want to know which best practices your pricing table is missing? Get your 3 free opportunities →
 10/100

Curated by
Gabriel Amzallag , Founder, Web Anatomy
5 years CRO + SEO at Qonto (2021–2025). After advising 15+ SaaS on their websites (Payfit, Pigment…), the same patterns kept breaking, so I decided to build the source of truth on what works on the web: the intelligence layer every tool, builder, and team uses to ship sites that perform.
Real examples from top landing pages, scored and analyzed.
Everything you need to know about pricing table design, based on our analysis of real landing pages.
Three or four. Two plans don't give enough context for comparison. Five or more creates visual overload and slows the decision. Three plans with a highlighted "recommended" tier is the most common format in our database of 38 pricing tables. If you have an Enterprise plan, show it separately with a "Contact us" CTA.
The pricing section is the whole package: headline, plan descriptions, price tags, CTAs, risk reducers, FAQ. The pricing table is the feature comparison matrix specifically: feature rows, plan columns, checkmarks. Some pages combine both. Others put the table on a dedicated sub-page. What matters is that visitors can compare plans in under 10 seconds.
If you have more than two plans with different feature sets, yes. Without a table, visitors have to open each plan individually and compare from memory. A table reduces cognitive load and speeds up the decision. The exception: if your pricing is simple (single plan, or a freemium + one paid tier), a table adds unnecessary complexity.
The pricing table shows differentiators between plans, not a full product catalog. If a feature exists in every tier ("Web app, mobile app, email support"), it belongs in the features section, not the table, or in a single "Included in all plans" row at the top. The table should make the upgrade logic obvious: why would someone jump from Starter to Growth? Every row that isn't part of that answer is noise. Aim for 10-20 differentiating rows, not 60, with the top row being the single feature that drives most upgrades.
One plain-English sentence plus a concrete example. "Advanced analytics" is ambiguous. The tooltip should say what that means here: "Custom dashboards with cohort analysis and funnel breakdowns." Skip the marketing copy. Skip the "learn more" link inside the tooltip, because hovers that lead to clicks that leave the page break the comparison flow. Tooltips exist to resolve the confusion right there, not to start a second journey. If a feature name doesn't need explaining, don't add a tooltip just for consistency. Empty tooltips erode trust in the filled ones.
Check that the feature matrix is easy to read, grouped by category, and shows the differences between plans. Then look for a CTA row, tooltips that explain the terms, and headers that stay in view as you scroll. Or get your 3 free opportunities, ranked with the evidence behind each.
Showing 1–29 of 38 examples