
TL;DR
- There are two ways to get more leads. More traffic, or a better conversion rate on the website. 90% of businesses only try the first one.
- Generate ideas at three levels. Best practices, the market (your competitors) and your users (your own data).
- Rank them with RICE. Reach, Impact, Confidence, Effort, a score from 1 to 10 for each.
- Measure every change. One hypothesis per change: "Because we saw X, we think changing Y will move M. We'll know in N weeks."
Everyone is looking for more leads from their site right now.
You have two ways to get there:
- More traffic
- Or a better conversion rate on the website
Yet 90% of businesses will try at all costs to grow their business with the first method.
This is how I see them.

That's what this guide is about: how to improve your website conversion rate with the traffic you already have. How to:
- Know whether conversion is worth it for your business
- Generate opportunity ideas
- Rank them to know where to start
- Push these changes and monitor them properly
It's as simple as that, and by the end you'll be able to really start optimizing instead of chasing traffic forever.
1. Is conversion rate optimization worth it for me?
I think it's the remark I hear the most when I talk about conversion.
"It's not for me."
So here are 5 answers to the usual objections, to make the case for this topic:
- "My priority is traffic." By working on conversion you work on the experience of your pages. The longer people stay on your pages, the more Google values your user experience, the better your ranking and the more traffic you get. Google itself says it uses "aggregated and anonymized interaction data to assess whether search results are relevant to queries."
- "I don't have the budget." Conversion doesn't mean a big budget. Most of the tools, including the ones I recommend in this guide, are free.
- "I want results fast." Change a call to action on your site and the result can come right away, not in a few months like SEO. You can't hope for faster. The change is live today. Measuring it takes a few weeks.
- "I'm too small, we won't see results." Trust me, if you get a +50% increase in leads you will see the impact quickly.
- "I don't know what to test." This guide gives you plenty of methods to get ideas.
Conclusion: whether you're a local business or Amazon, you need to think about this.
2. How to always have ideas to increase your conversion rate
The first phase is to generate as many ideas as possible for your website, so you can build a list of ideas.
Depending on how mature your business is, there's no point jumping into complex data-analysis workflows.
You can already improve your conversion rate at 3 levels: best practices, the market and your users.
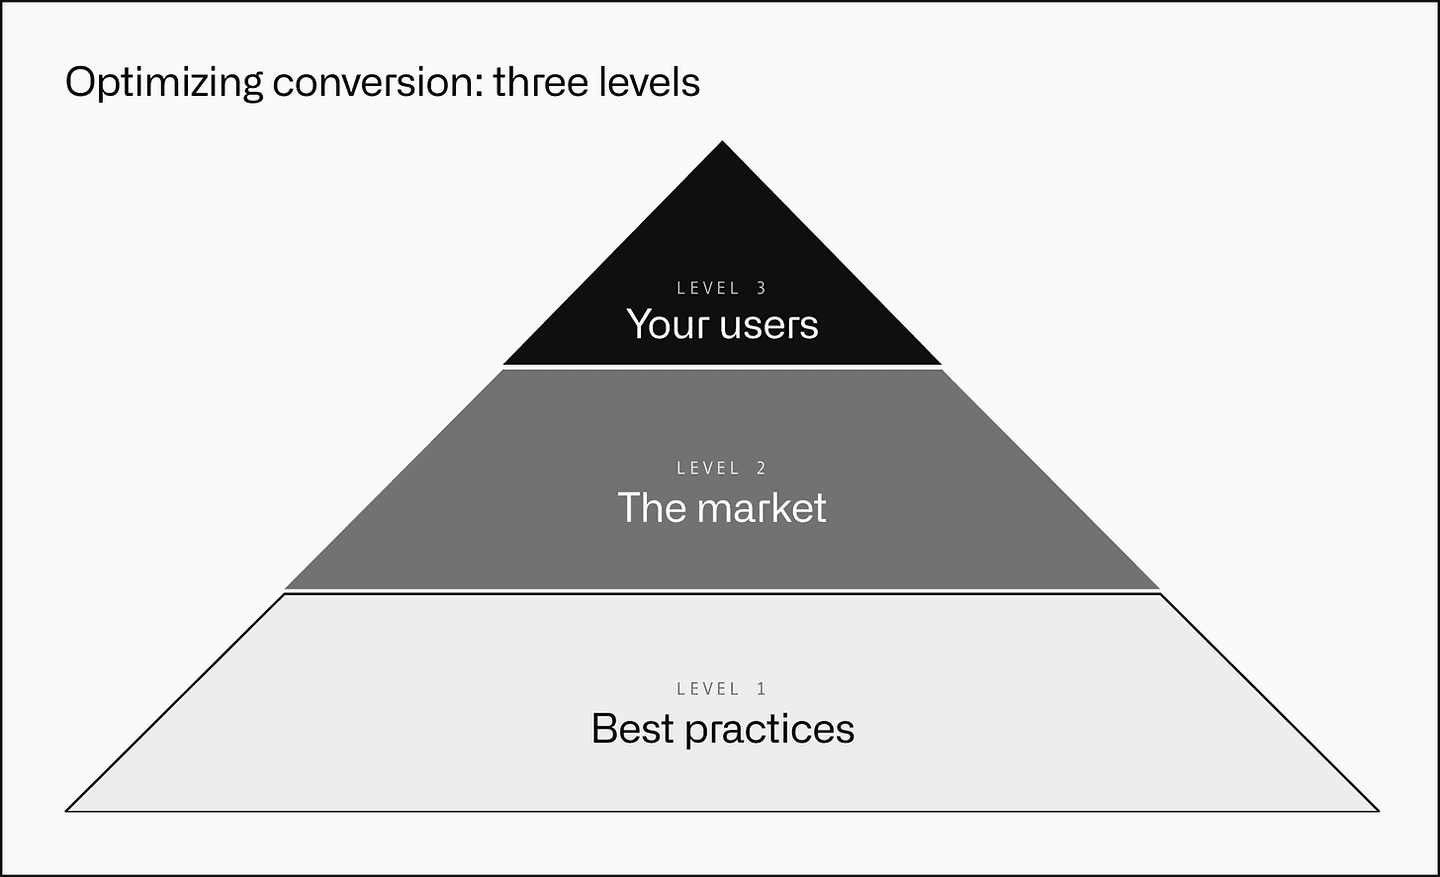
Level 1: follow best practices
First level, it's easy: just look for best practices, patterns that have been proven in terms of copywriting, design and user experience. For that, no need to reinvent the wheel.
Follow what many other companies in your space have already tried.
I built a conversion best-practices tool, the Landing Page Analyzer, to do that job for you.
You enter your URL and you get:
- A score
- Your top weakness in each category
- Your top 8 recommendations, each with a screenshot example you can use
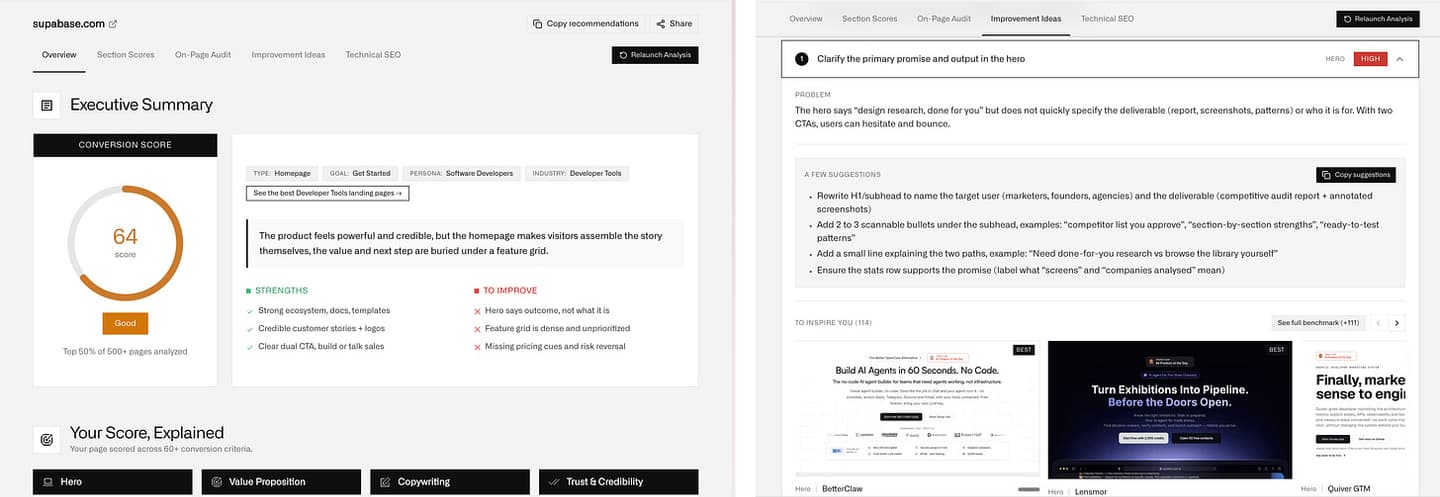
Unlike a generic AI chat, it analyzes both the content and the design of your page, and checks them against the conversion criteria I've collected over years of audits.
You can also copy the recommendations and paste them straight into ChatGPT or Claude.
Level 2: the market (competitor analysis)
It's a matter of analyzing what your competitors are doing, understanding what they do well and badly, and how you could take their best practices.
Here is a prompt you can give Claude to do it.
Here is my website: {my homepage URL}
It sells {what you sell} to {who buys}.
My competitors: {competitor 1 URL}, {competitor 2 URL}, {competitor 3 URL}.

1. Open each homepage (live, not from memory). If a page won't load, say so and skip it.
2. For each page, note, quoting the page's exact words:
   - Main CTA: the button label and what it asks for (website field, signup, demo)
   - The line under the CTA (no card needed, free trial…)
   - Social proof: logos, testimonials, reviews (with the figures)
   - Results shown: before/after numbers, case studies
   - Risk and price: free plan, trial, guarantee, prices shown or not
   - Time to value: setup, time to first result
   If something isn't on the page, write "none". Don't guess.
3. Put it in one table: one row per item, one column per site, mine first.
4. Under the table, three short lists:
   - What 2+ competitors do and I don't
   - Where I'm already stronger
   - What none of us says (room to stand out)
5. End with 5 changes to test on my homepage. For each: the section, what to change,
   which competitor it comes from, and the hypothesis ("if we…, then… because…").
   No generic advice: every change must point to a cell in the table.
I'm trying a new offer on my business page to discover SEO/GEO opportunities.
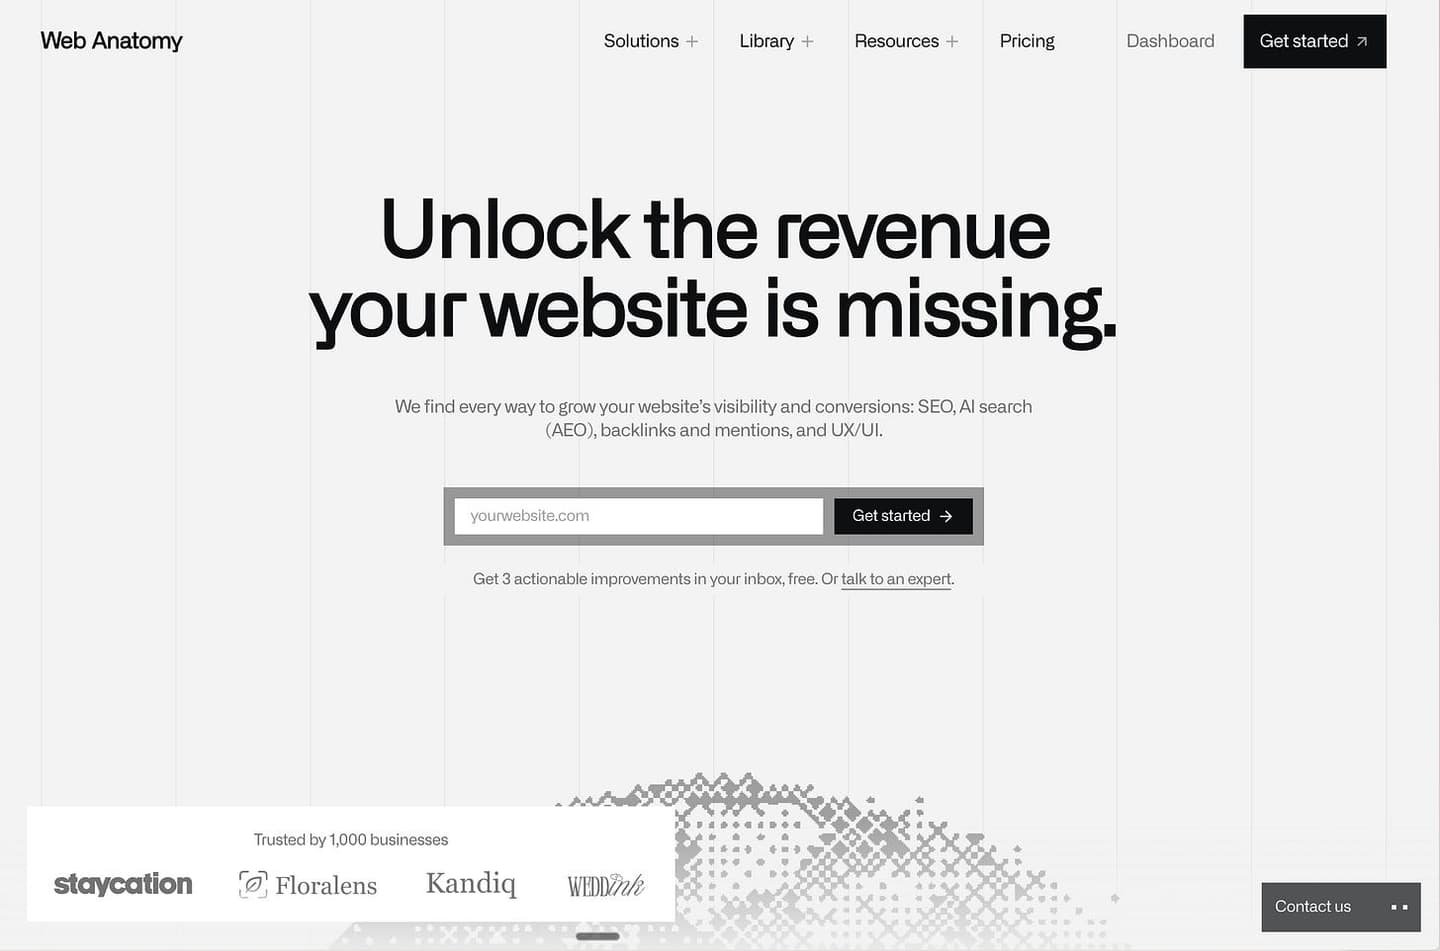
I ran this prompt against RankAI, Semrush and Ahrefs, and quickly saw where my page was weak.
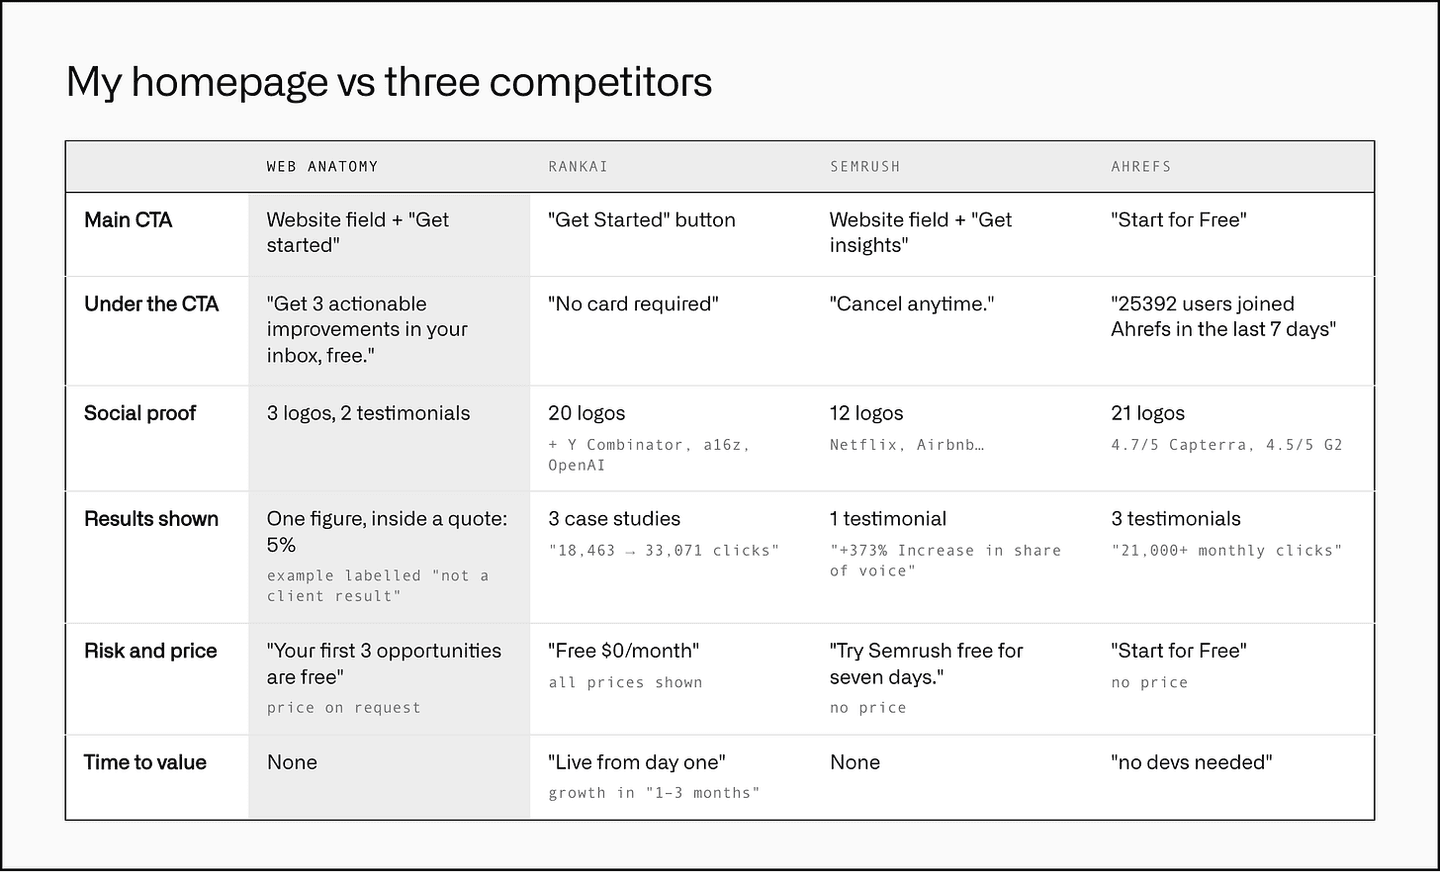
The same table in text, as the pages read in October 2026:
| Web Anatomy | RankAI | Semrush | Ahrefs | |
|---|---|---|---|---|
| Main CTA | Website field + "Get started" | "Get Started" button | Website field + "Get insights" | "Start for Free" |
| Under the CTA | "Get 3 actionable improvements in your inbox, free." | "No card required" | "Cancel anytime." | "25392 users joined Ahrefs in the last 7 days" |
| Social proof | 3 logos, 2 testimonials | 20 logos (+ Y Combinator, a16z, OpenAI) | 12 logos (Netflix, Airbnb…) | 21 logos (4.7/5 Capterra, 4.5/5 G2) |
| Results shown | One figure, inside a quote: 5% (example labelled "not a client result") | 3 case studies ("18,463 → 33,071 clicks") | 1 testimonial ("+373% Increase in share of voice") | 3 testimonials ("21,000+ monthly clicks") |
| Risk and price | "Your first 3 opportunities are free" (price on request) | "Free $0/month" (all prices shown) | "Try Semrush free for seven days." (no price) | "Start for Free" (no price) |
| Time to value | None | "Live from day one" (growth in "1-3 months") | None | "no devs needed" |
You can see at a glance where your pages are strong, whether you have social proof and design elements, and what your competitors' pages do. I put it in a real table comparing the different angles.
Quick wins for me to implement.
Level 3: your users (your own data)
Finally, the best way to generate ideas: with the data you already have.
In practice you can collect two types of data that will let you build hypotheses you can test on your site.
1. Qualitative:
- Session replays, to understand how people really interact with your pages
- Your CRM, sales and customer support data, to rewrite your FAQ and feature benefits in your customers' own WORDS
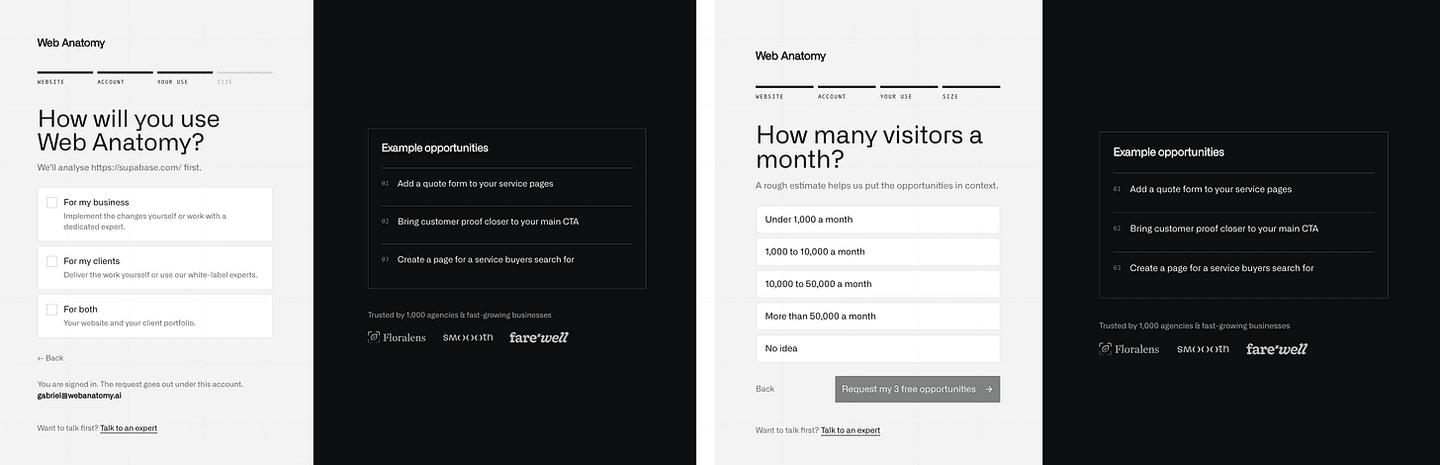
- Surveys. I run one, for example, in my onboarding form to qualify my prospects better and know their budget.
2. Quantitative:
You have various tools for this (Clarity, or Contentsquare's free plan, formerly Hotjar).
With these, you can check the number of clicks on the CTA and the scroll depth on the page, spot rage clicks, and track many other interesting UX indicators.
The filter for all three levels: avoid AI slop
I haven't seen a measured impact of this on conversion, but there is starting to be real visual fatigue with AI content and AI design.
So if you want to stand out from your competitors, I recommend reading the two editions I wrote on the subject:
3. How to prioritize conversion ideas with the RICE framework
OK, you have a backlog of actions. But where do you start?
Prioritization is the most important part of conversion.
For this I use the RICE framework, to know exactly:
- Which pages to prioritize
- What to change for the most impact
The four criteria:
- Reach: in practice, your traffic. Which of your pages get the most traffic (homepages and pages used in ads usually win).
- Impact: look at the page type. A blog article has small potential, even with a lot of traffic. A product page has high potential.
- Confidence: how sure are you that your change will have an impact? Does a competitor do it? Do you have data to justify it? The stronger the rationale, the more impact the change will have (so be as sure as possible).
- Effort: how hard is it to put in place? You don't change a button color the way you redo a whole section or page. (Start with the changes that take the least effort.)
A score from 1 to 10 for each.
Here are projects that will end up at the top of the list (easy and strong impact):
- Add a social proof band to my homepage
- Change the buttons to "Try for free" rather than "Get started" on an ads page
- Add micro-copy under the site's CTAs to remove friction (no account needed, no credit card)
And the ones that will end up at the bottom (no guaranteed conversion or small reach):
- Redo your "About" page
- Redo your site's footer
- Redo an Expertise page (that gets 3 visitors a month)
4. Measure each change to your conversion rate
Once a change is live, the goal is to measure it.
For each action you take on your website, you need one hypothesis you want to prove.
For example, if you revamp your homepage and add social proof, write it down and confirm or reject the hypothesis. This is the basis of conversion. Don't ship too many changes at once, or it will be hard to see which one had an impact.
The logic to have is: "Because we saw X, we think changing Y will move M. We'll know in N weeks."
If you have enough traffic, you can launch an A/B test, but don't consider it if you have fewer than 500 conversions per month on your website.
What should your website deliver next?
Choose your priority. Together, we define the objective, the work and how to measure results.
If you don't know where to start, our conversion rate optimization service tells you what to test first on your site.
Adapted from You don't need more traffic, originally published in the Web Anatomy newsletter on October 23, 2026.

Written by
Gabriel Amzallag , Founder, Web Anatomy
5 years CRO + SEO at Qonto (2021–2025). After advising 15+ SaaS on their websites (Payfit, Pigment…), the same patterns kept breaking, so I decided to build the source of truth on what works on the web: the intelligence layer every tool, builder, and team uses to ship sites that perform.
More from the blog
Playbooks
We analyzed the ads the top EdTech companies run. Here is what works.
Which EdTech ads kept running through the summer of 2026, the eight angles they use, and the pages behind them. The takeaways, with the ads to look at.
 Gabriel Amzallag24 min read
Guides
AI SEO content workflow: how to publish one page a day without publishing slop
The four parts of the AI content machine behind Web Anatomy's SEO pages: a roadmap CSV, a page template, a skill file per page type and a daily routine. The agent makes zero strategic decisions.
Gabriel Amzallag10 min readPlaybooks
We analyzed the ads the top design tool companies run. Here is what works.
Nine angles the design tool ads that keep running use, the five nobody runs, and the pages behind the clicks. Eight advertisers, 229 Meta ads, one sweep.
Gabriel Amzallag25 min read