Problem|
A social-validation problem section shows the pain is widely shared, using an aggregate stat, a cited report, or scenarios the reader recognizes, so the problem reads as real and common instead of a personal failing before the visitor decides.
Key takeaways
Showing 1–12 of 12 examples





Browse every problem pattern by UX best practice.
Every problem section is scored across 5 conversion best practices. Copy the best practice stack, not the layout. See what converts and why.
Hand-picked from {companies} companies and analyzed by our AI conversion agent. Real problem sections on live landing pages. Every entry earns its spot.
Found a problem section you admire? Run yours through the same scoring engine. See where you stand on the same best practices, and what to fix first.
A social-validation problem section is the decision to prove the pain is widely shared, not just to describe it. A plain problem section tells the reader the current setup is slow, scattered, or wasteful. A social-validation section shows how many other people are stuck in the same place: the share of users who give up, the percentage of projects that fail, the number of buyers who walk away for the same reason. That evidence is what turns a private "maybe it is just me" into a public "this is a known problem," which is a far easier place to sell a fix from.
The best problem sections prove the pain is common in one of a few ways, often more than one at once:
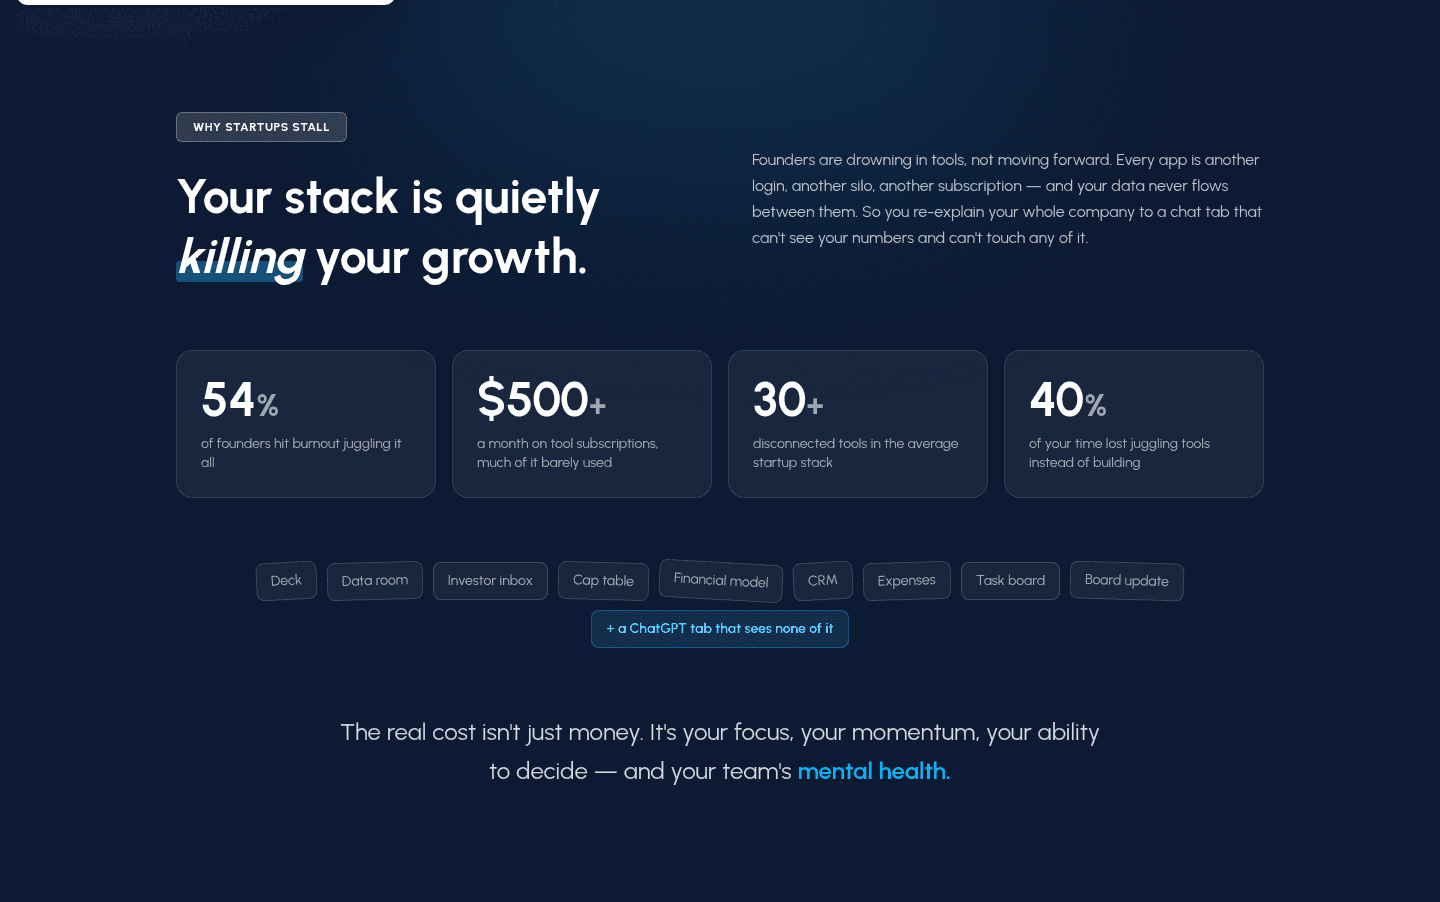
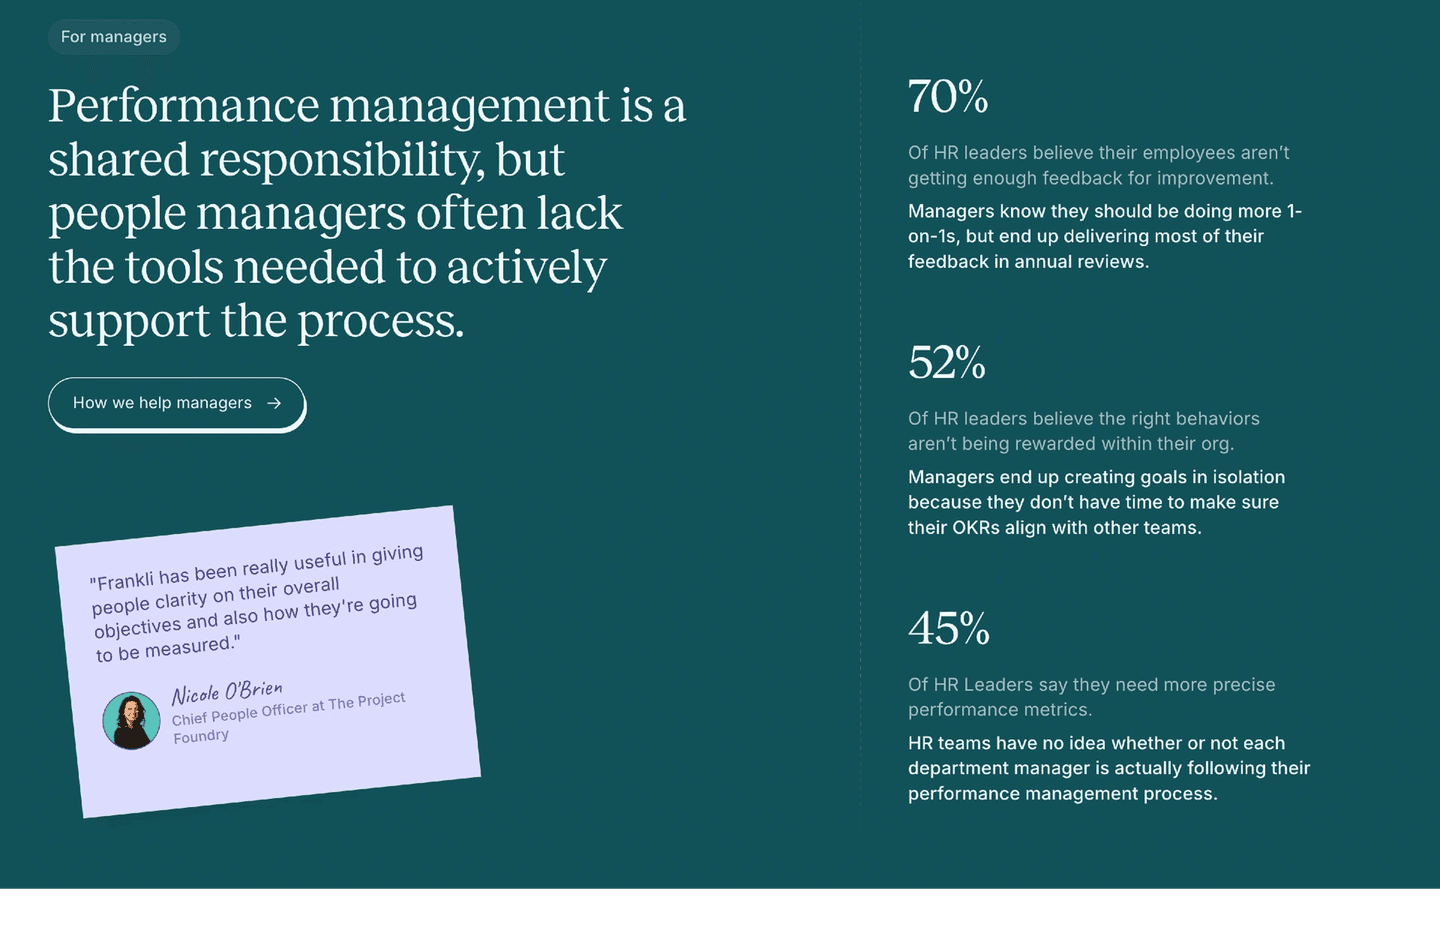
People often sit with a broken setup because they quietly suspect the fault is theirs. An aggregate number breaks that suspicion. When Nautis shows that 54% of founders burn out, or Deep leads with up to 84% of digitalisation programmes failing, the reader learns the wall is one most people hit, not a sign they are bad at their job. The shame that kept them from acting drops, and looking for a fix stops feeling like an admission of failure.
The proof also borrows the credibility of scale. A figure about the crowd is harder to wave off than a claim about the reader alone, because it reads as something measured across many people rather than a line written to sell. Once the reader accepts that the problem is real and common, the section has earned the right to introduce the fix, and the reader is listening instead of bracing.
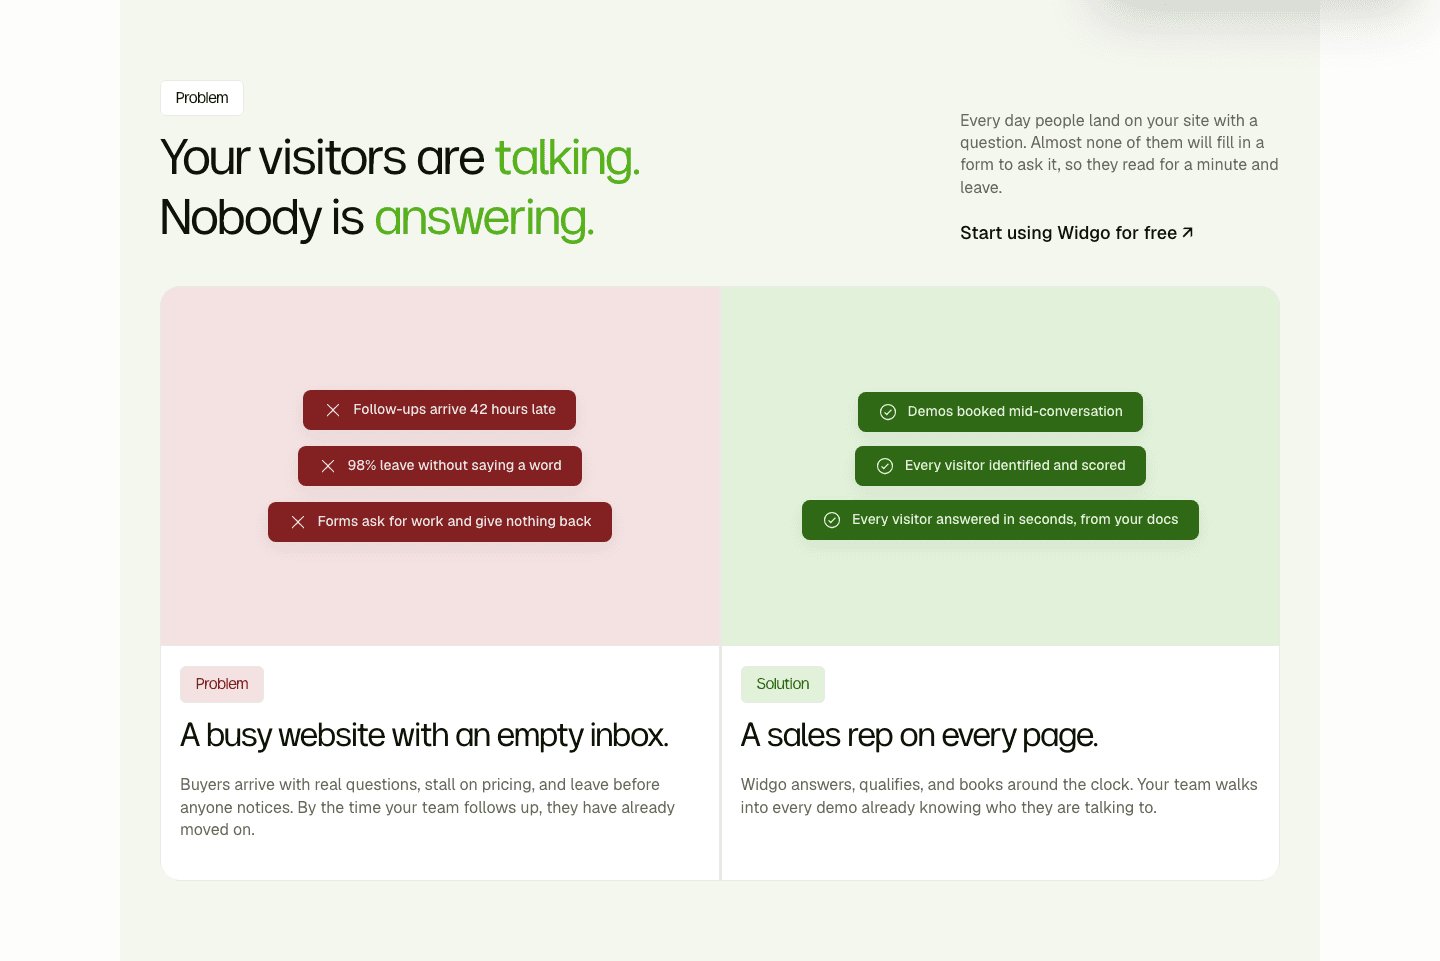
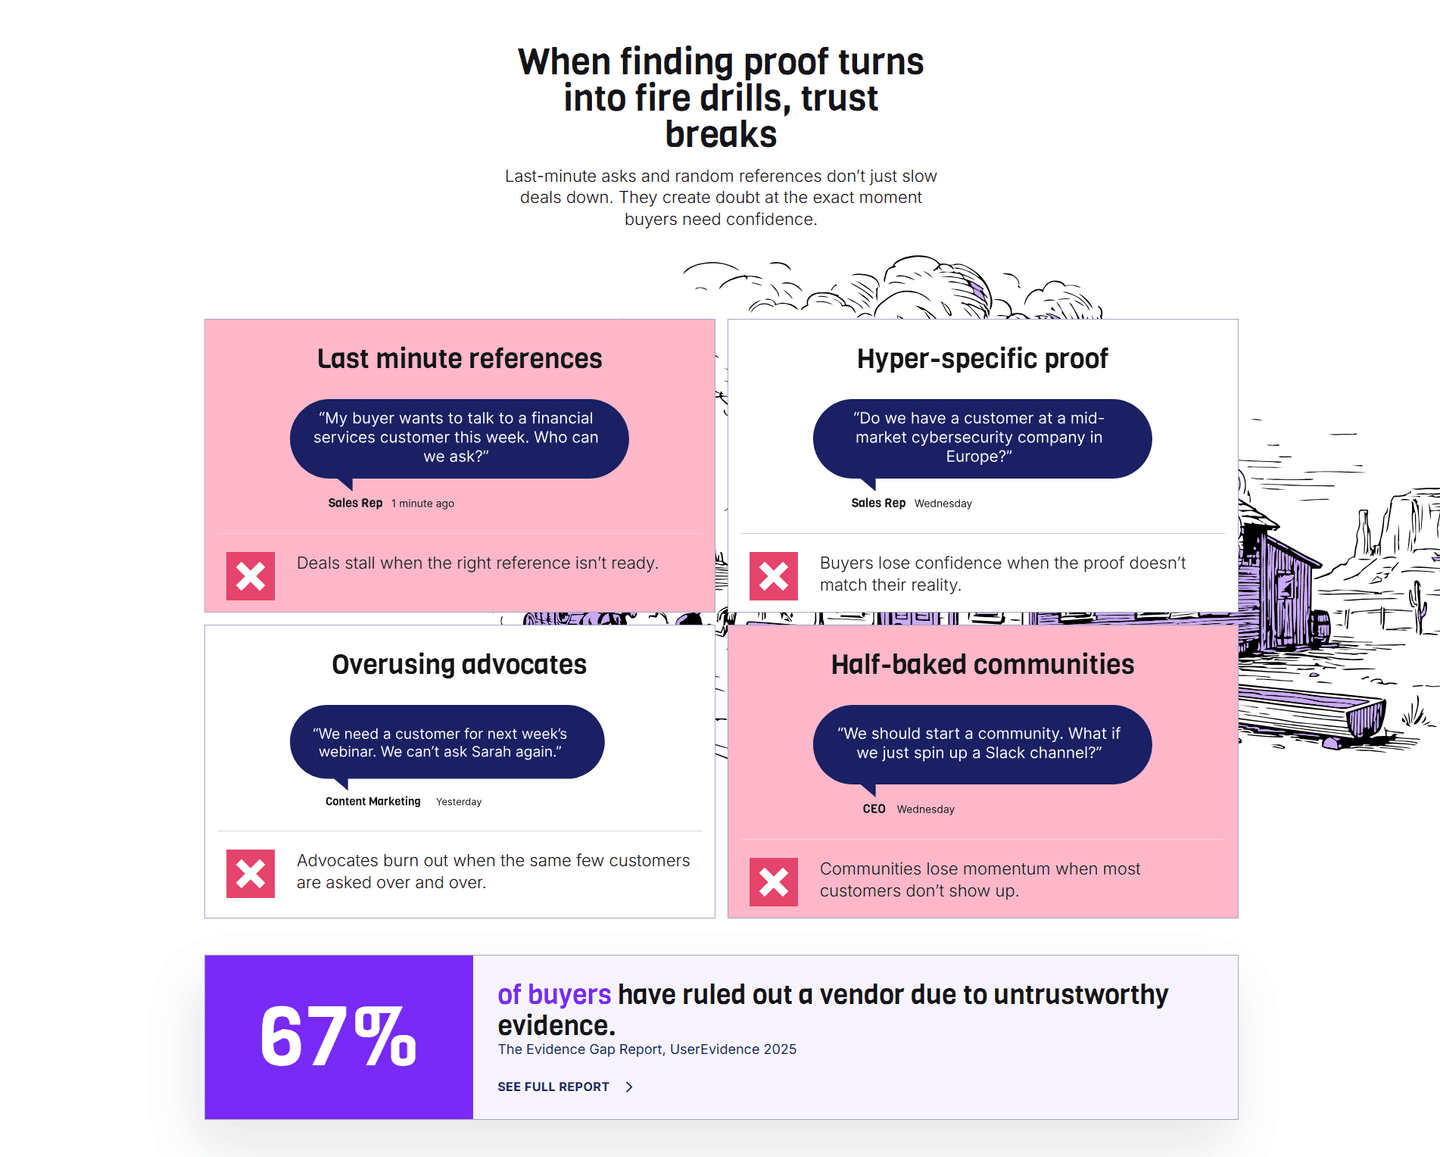
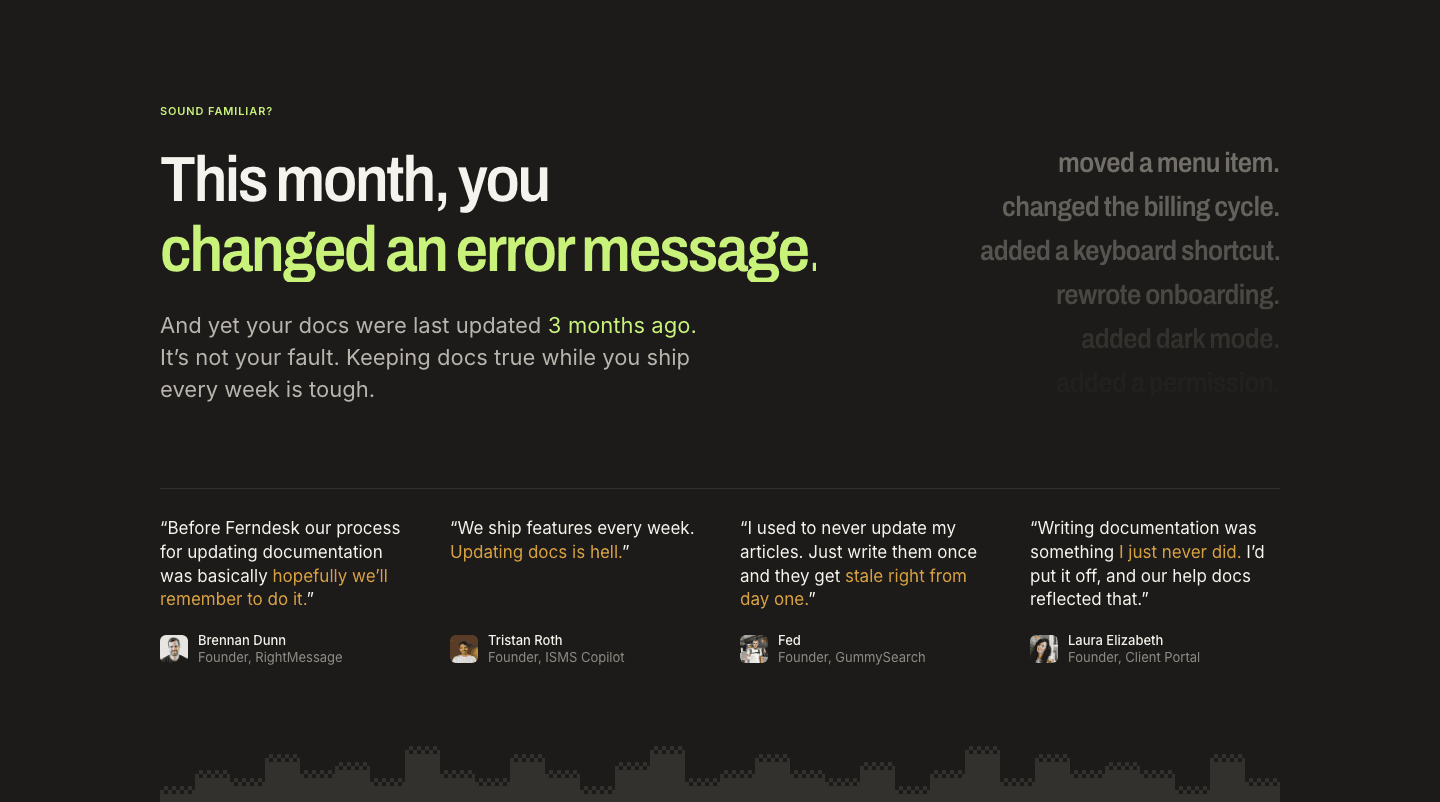
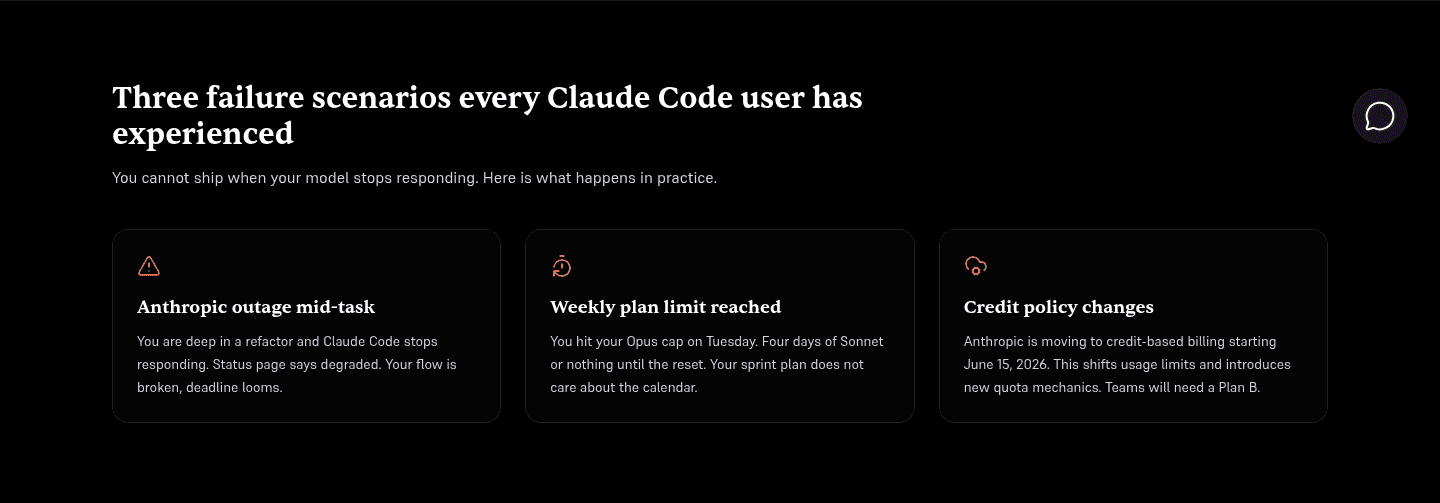
Across the scored examples below, the pattern that lands is a number that is clearly about other people, and clearly believable. The strongest sections point the figure at the crowd, so the reader hears "you are not alone," and they ground it so it reads as evidence rather than a boast. UserEvidence ties its 67% of buyers to a named Evidence Gap Report, so the stat carries a source. Bulkmark uses 97% of saved items never reopened, an aggregate behavior number nobody can pin on the reader personally. Edgee Fallback Models skips the stat entirely and frames the pain as something every Claude Code user has already lived through, which validates by recognition instead of by percentage. The move is the same each time: make the reader feel seen, and make the shared pain hard to dismiss.
This angle rarely stands alone. Proof that the pain is common gets sharper when it also puts a number on the pain, and it aims straight at the reader when the section speaks to one persona's specific pain. You can see the full range in the problem section gallery.
100/100 10/100
The usual failure is a validating stat with no source and no scale the reader trusts: a round percentage floating free of any report or any behavior the reader recognizes, so it reads as a number someone made up to scare them. The second failure is proof that widens the wound and then abandons it, piling on how bad and how common the problem is without ever signaling that a way out exists, which leaves the reader anxious rather than ready to act. The best examples avoid both by grounding the figure and aiming it at a situation the reader already lives with, the way Nautis, UserEvidence, and Bulkmark do.

Curated by
Gabriel Amzallag , Founder, Web Anatomy
5 years CRO + SEO at Qonto (2021–2025). After advising 15+ SaaS on their websites (Payfit, Pigment…), the same patterns kept breaking, so I decided to build the source of truth on what works on the web: the intelligence layer every tool, builder, and team uses to ship sites that perform.
We find every way to grow your website’s visibility and conversions: SEO, AI search (AEO), backlinks and mentions, and UX/UI. 3 free opportunities, delivered by email.
The common questions about proving the pain is widely shared in a problem section, with answers drawn from 12 scored examples.
It is a problem section that proves the pain is widely shared instead of framing it as a private struggle. Rather than only describing what hurts, it shows how many other people hit the same wall: an aggregate stat like the share of users who never come back, a figure pulled from a named report, a headline that says every person in the reader's role has felt this, or a set of everyday scenarios the reader recognizes. The point is to move the pain from 'maybe it is just me' to 'this is a known, common problem,' which makes the reader far more willing to keep reading.
People sit with broken setups partly because they suspect the fault is theirs. An aggregate number breaks that. When a section shows that most people in the same position lose the same time or make the same mistake, the reader learns the problem is a pattern, not a personal failing, and the quiet shame that kept them from acting drops away. The proof also borrows the credibility of scale: if this many people hit the wall, the wall is real, the reader is not overreacting, and looking for a fix is reasonable.
An aggregate statistic that shows prevalence, such as a share of users, buyers, or projects that hit the same failure. A figure sourced from a named third-party report, which reads as research rather than a claim the company wrote. A headline that frames the pain as universal for a specific audience. And a set of relatable scenarios, sometimes tagged to roles, that let each reader see their own version of the struggle. The strongest sections combine two, so the pain is both broad and specific.
Quantifying the pain measures how big it is; social validation proves how common it is. A quantified figure can be about the reader alone, like the hours their own setup wastes. A validating figure is deliberately about the crowd: the percentage of everyone in the same position who fails, drops off, or gives up. The two often ride together in one stat, but the social-validation job is specifically to signal 'you are not alone in this,' which is a different reassurance than 'here is what it costs you.'
It can, if the number feels invented or the section never points to a way out. A round, unsourced percentage reads as marketing and does less than an honest description would, so the strongest examples ground the figure in a cited report or in behavior the reader can recognize. And validation that only widens the wound, with no signal that the problem is fixable, leaves the reader anxious rather than hopeful. The best sections prove the pain is shared, then make clear a path exists.