Pricing|
Putting plans side by side is the baseline for any pricing table. These 100 examples show how the strongest ones make the plans easy to compare and quick to choose between.
Key takeaways
Showing 1–29 of 100 examples
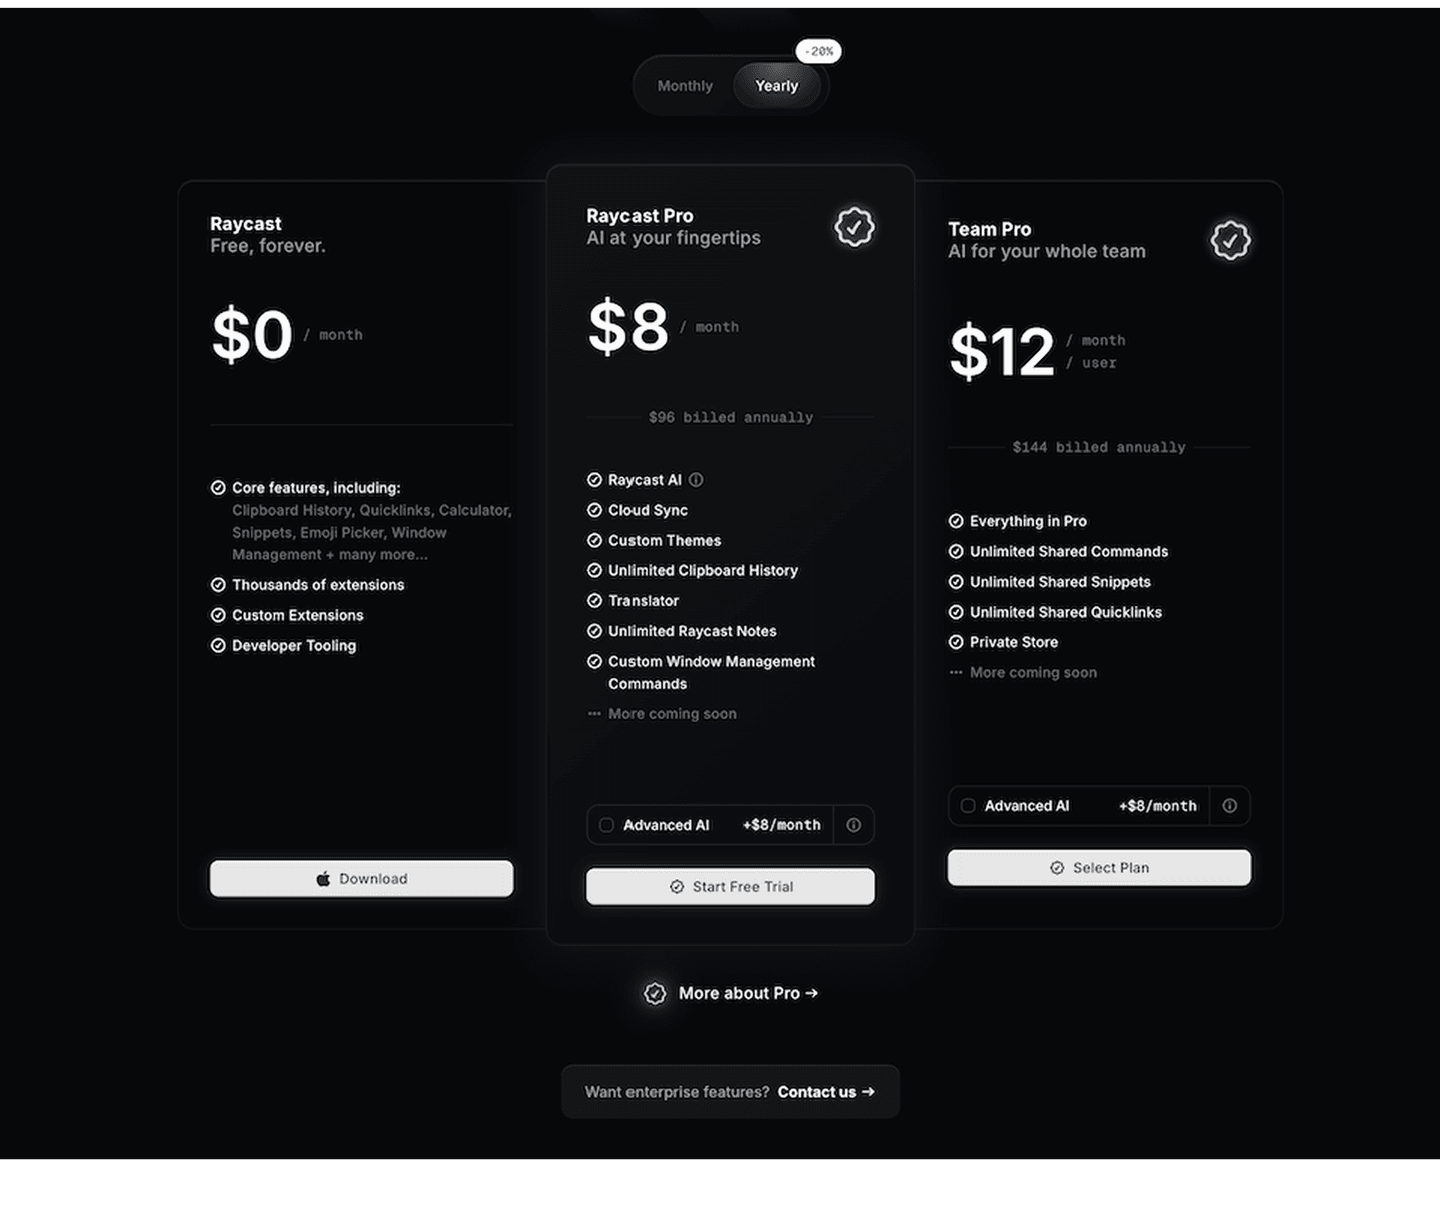
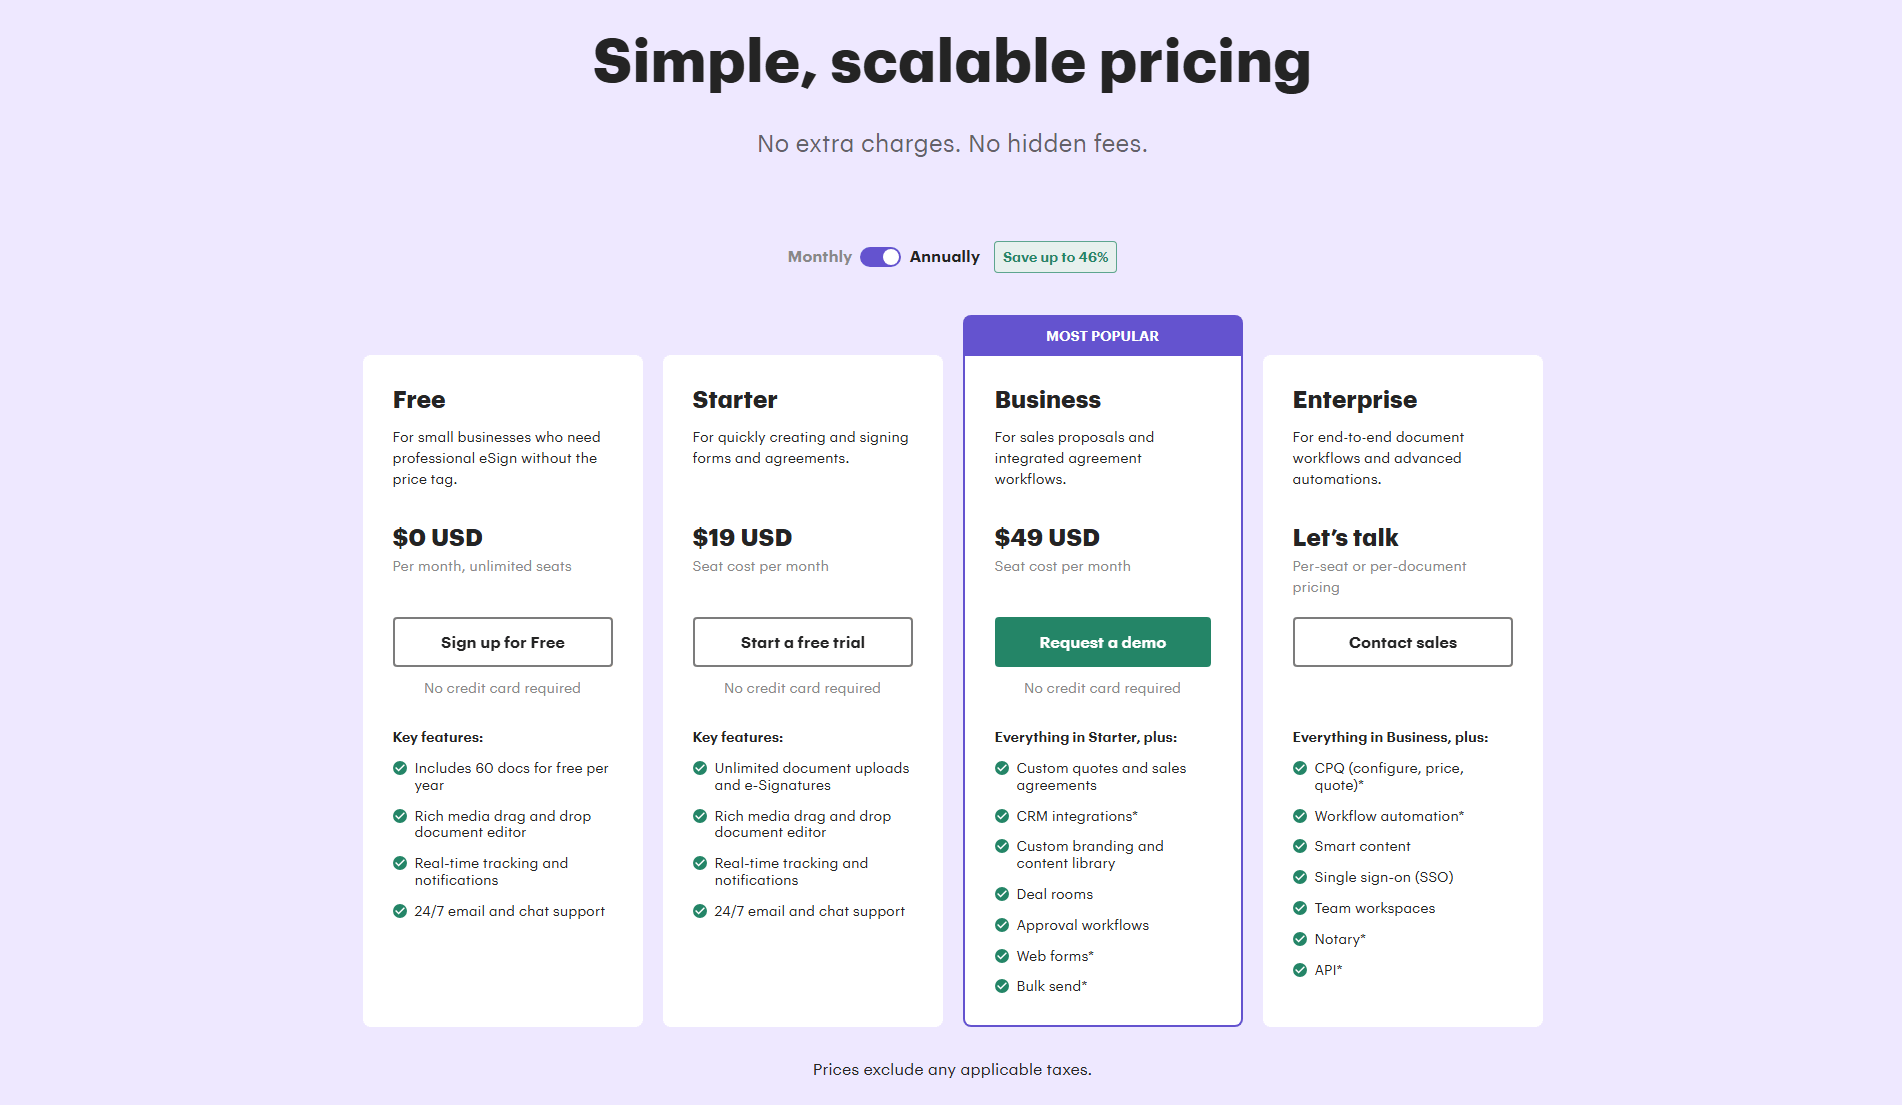
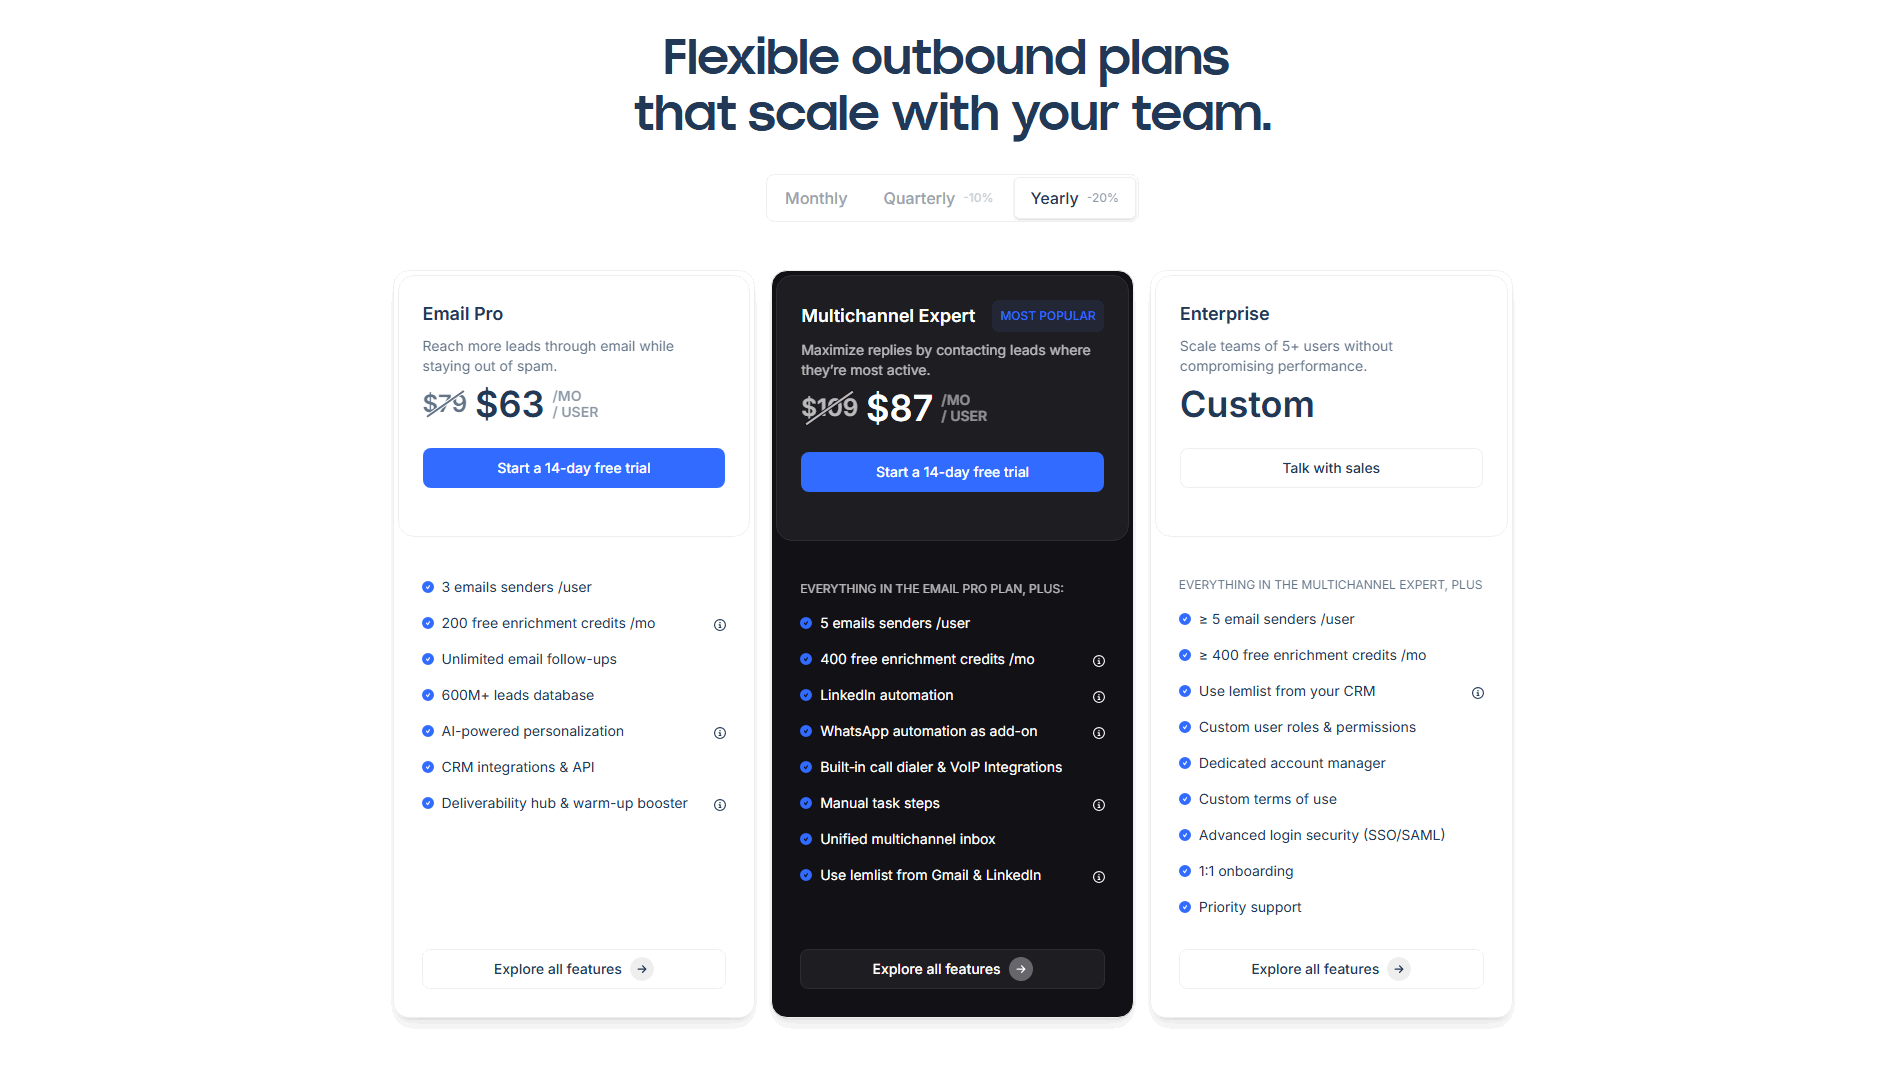
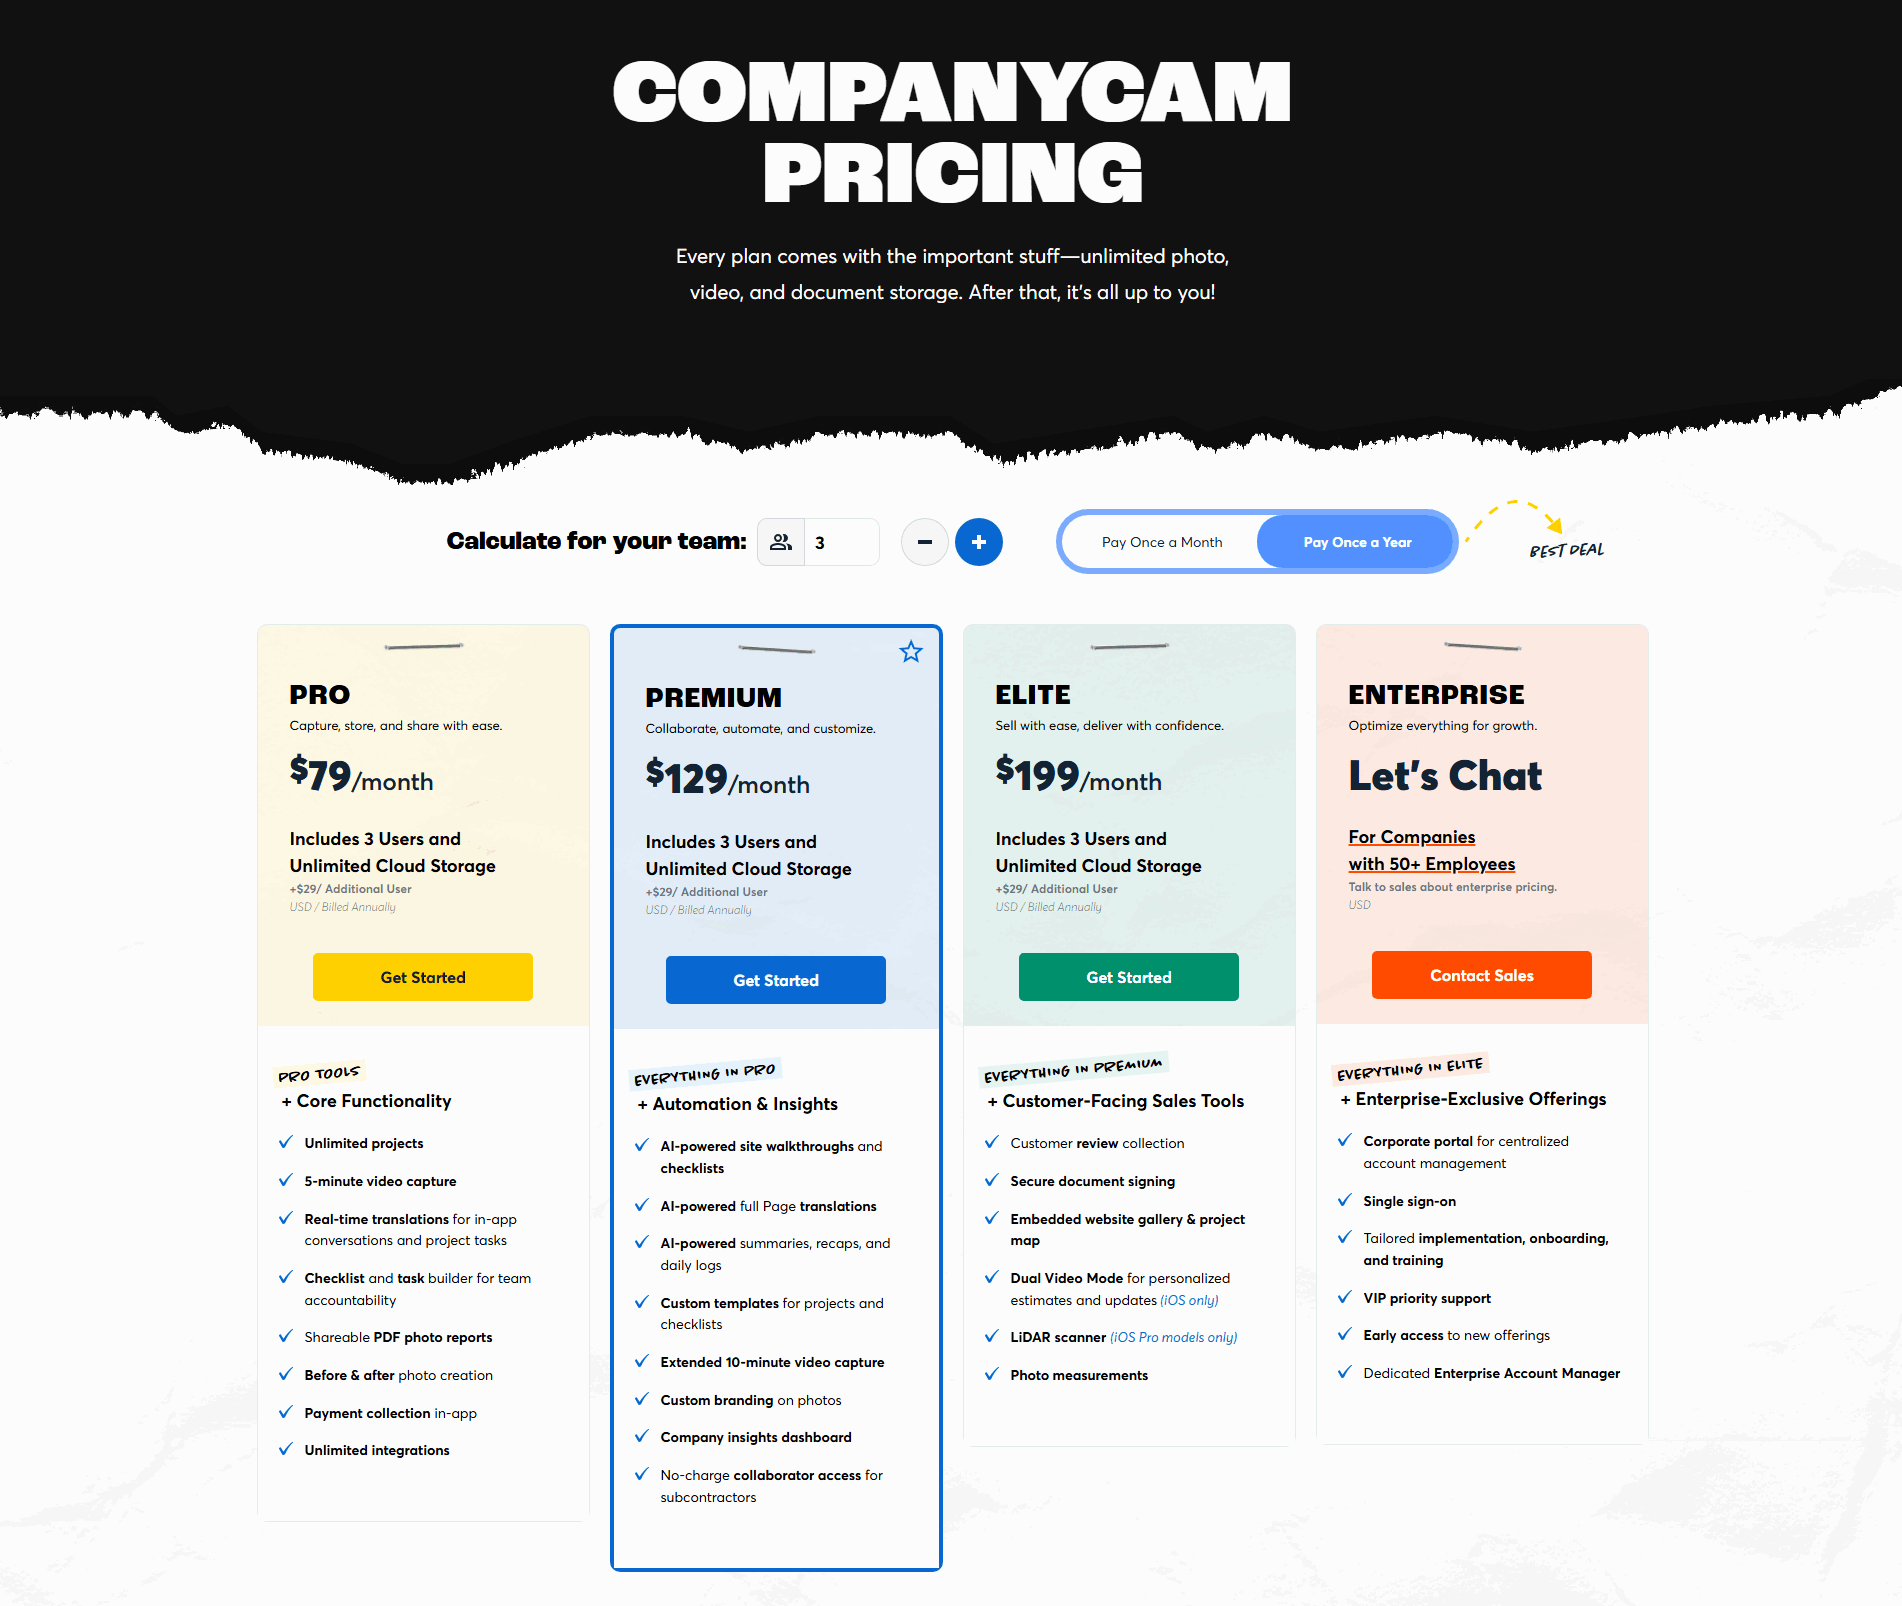
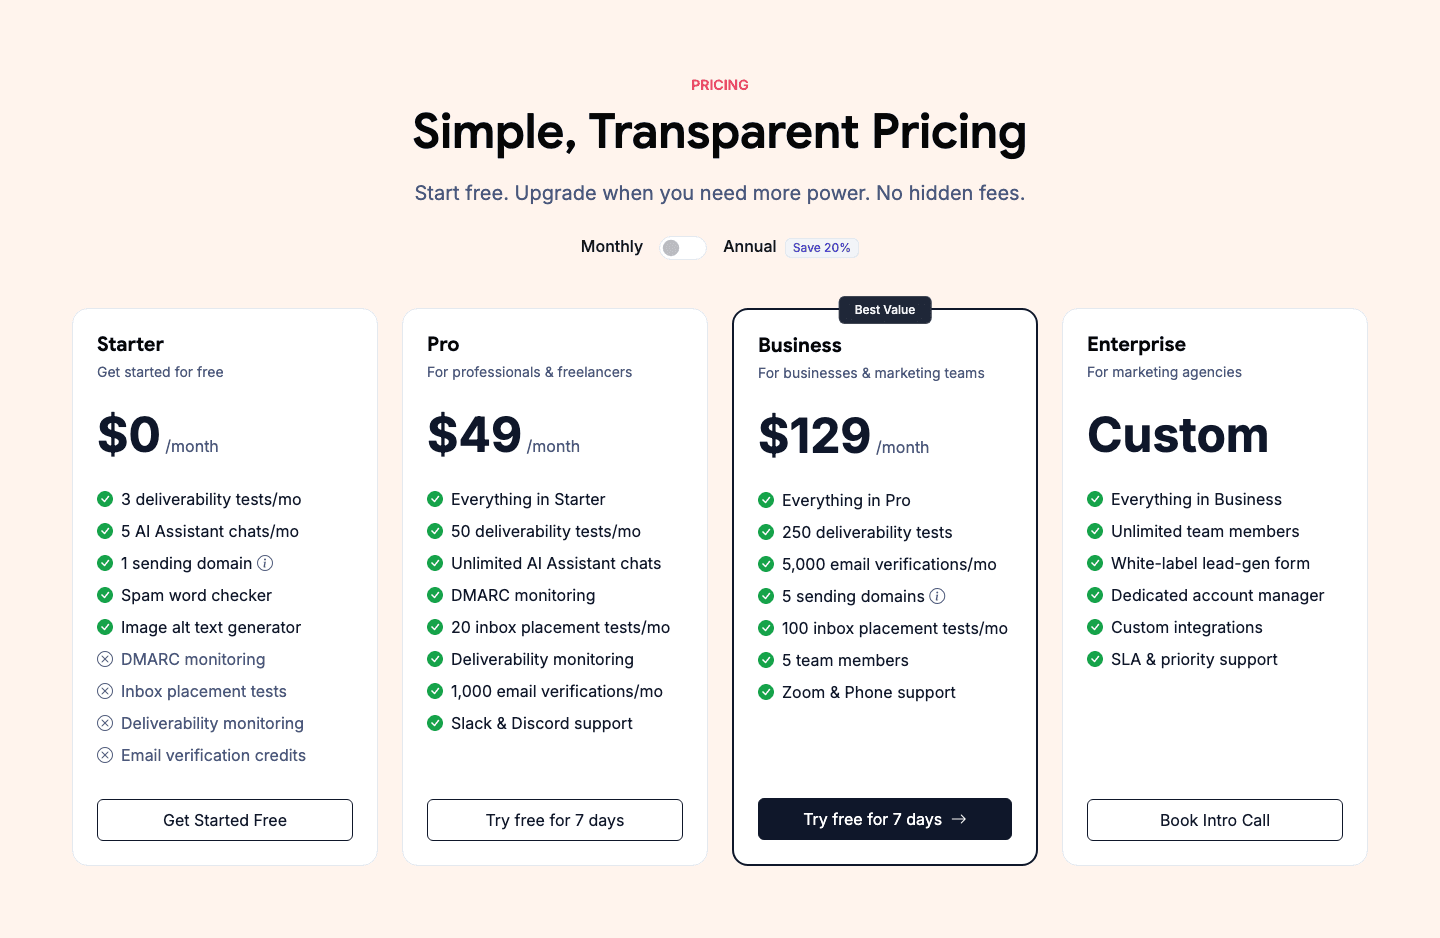
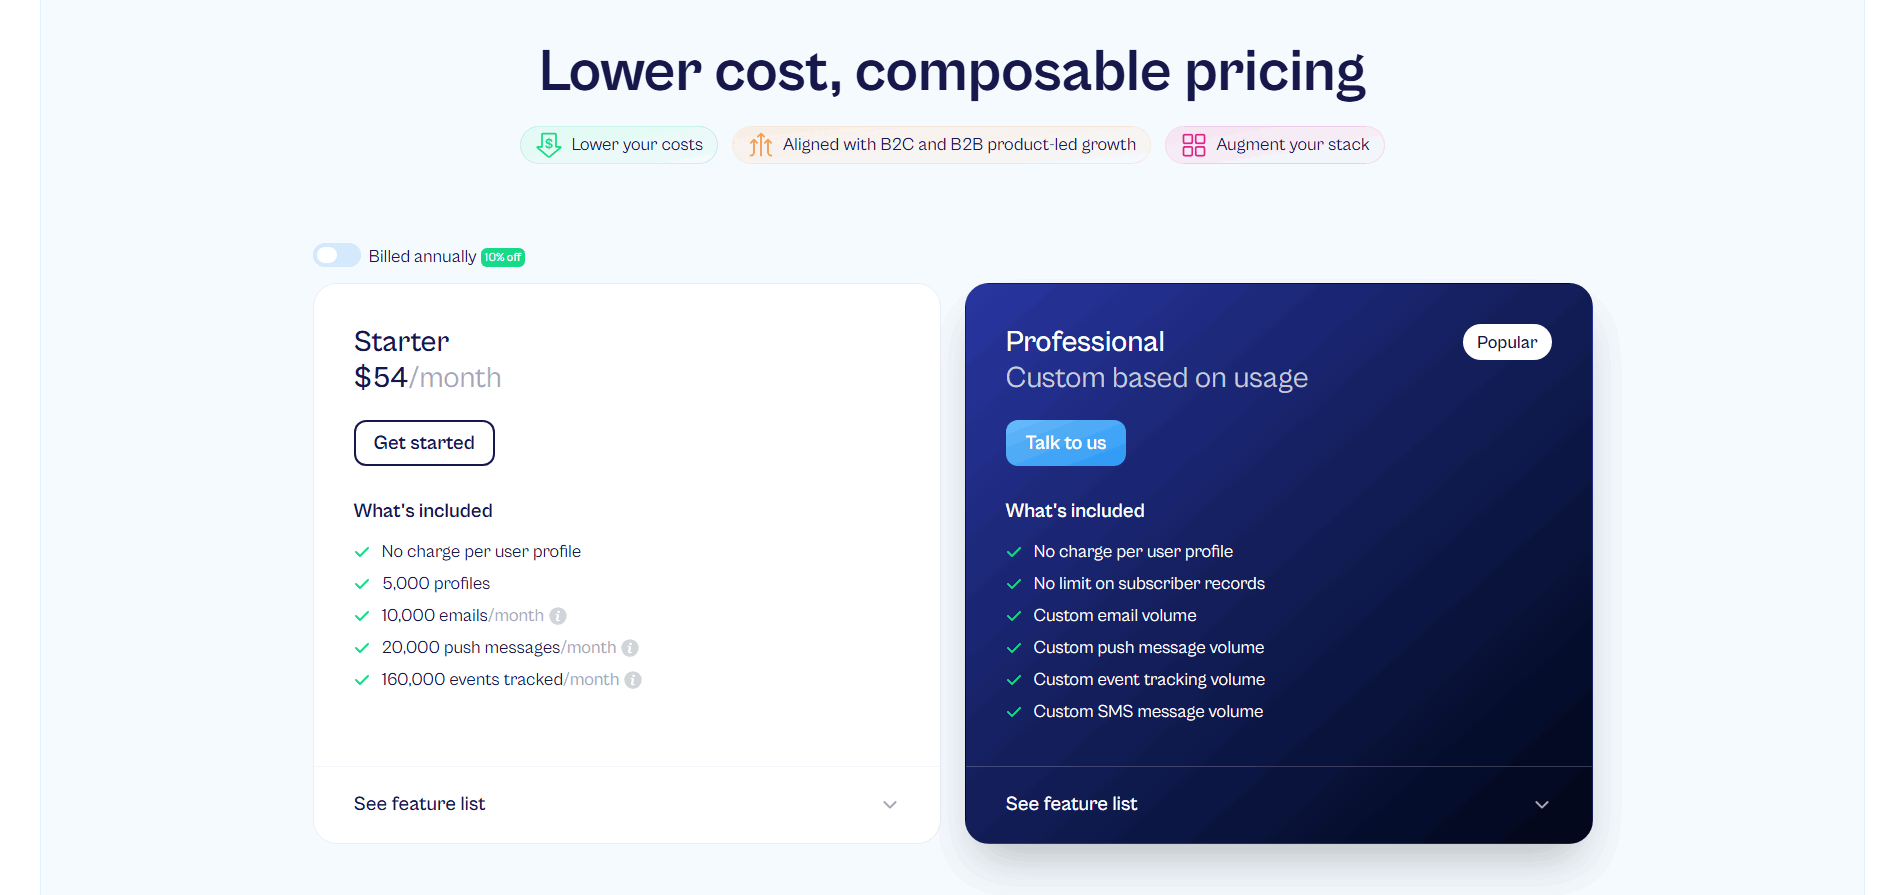
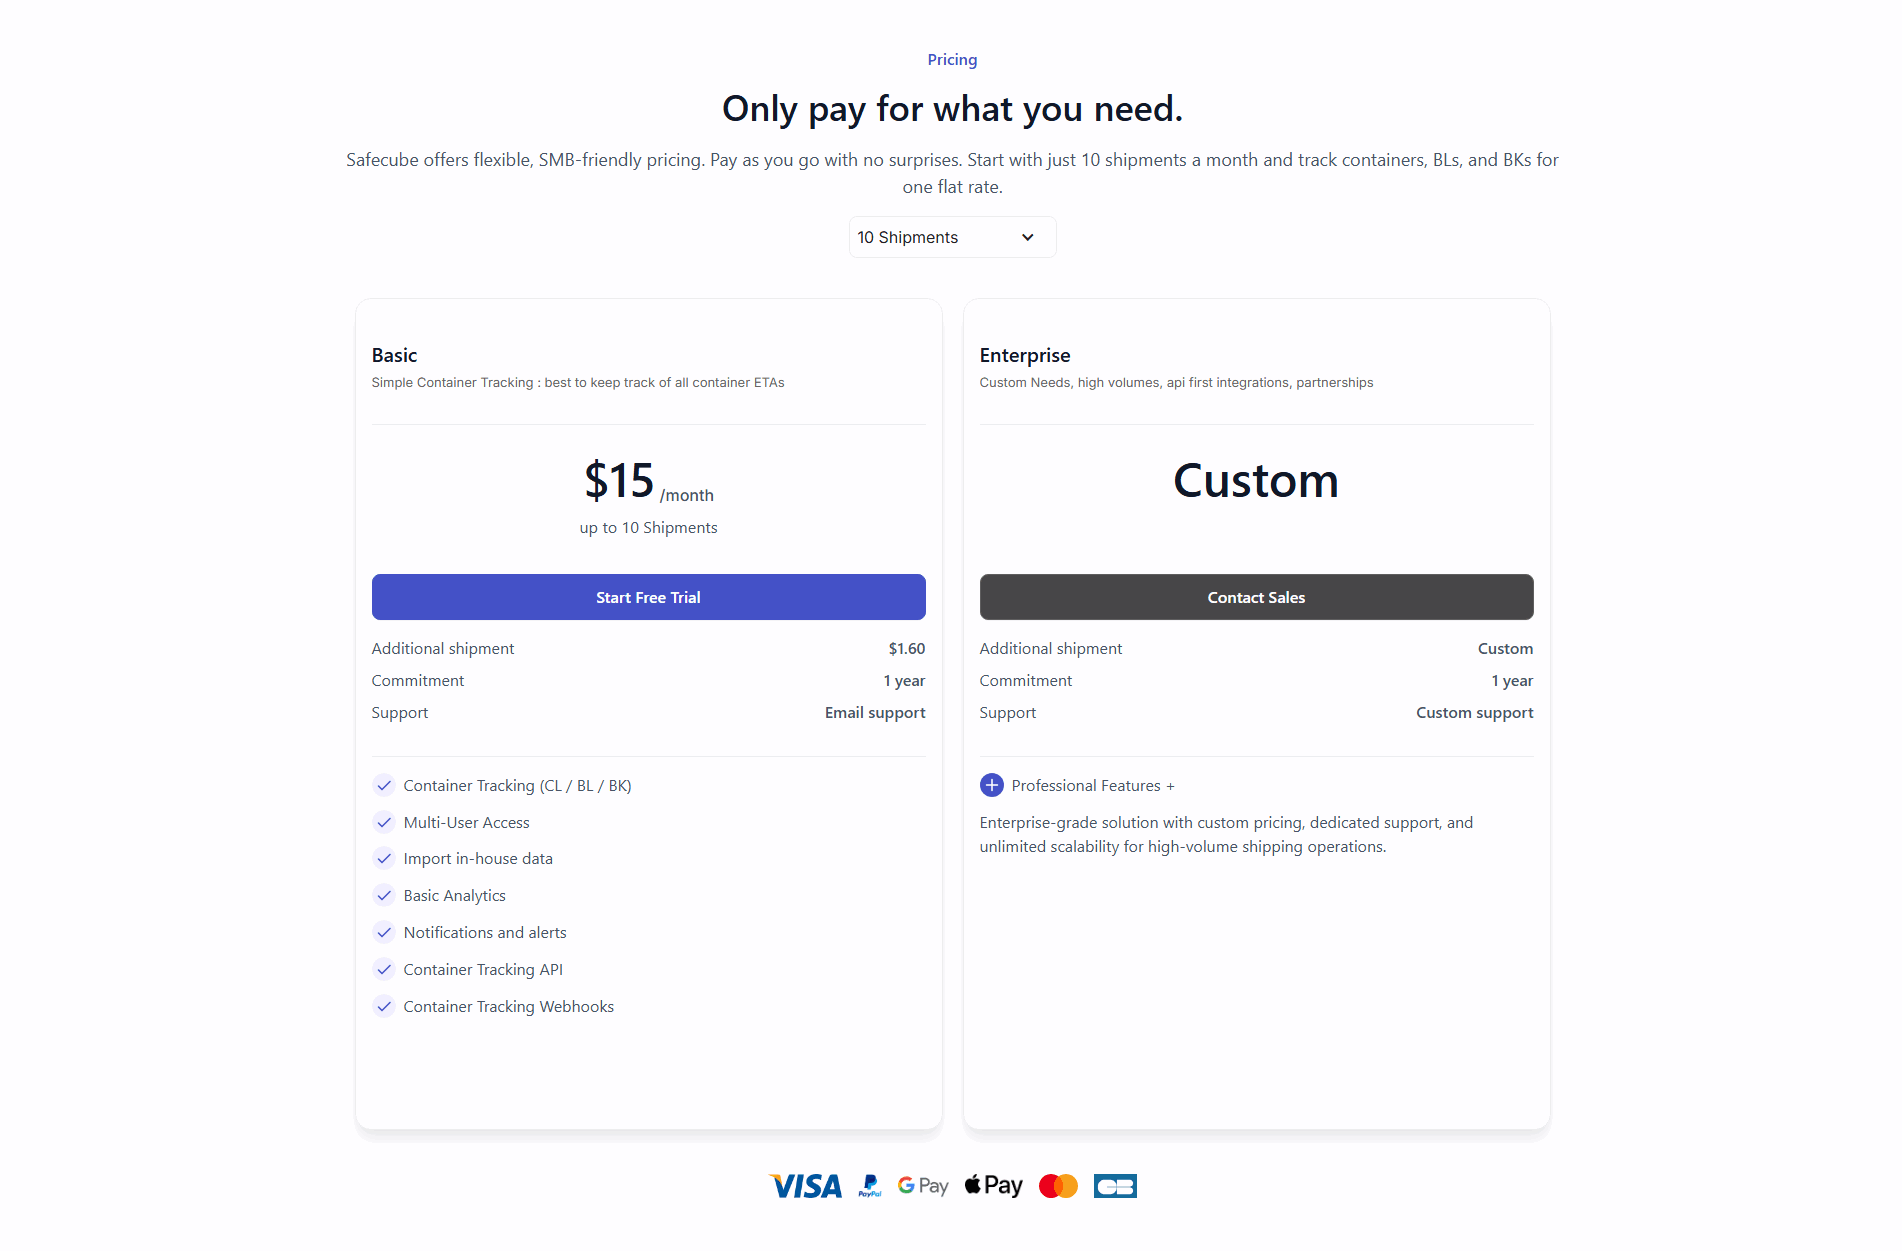
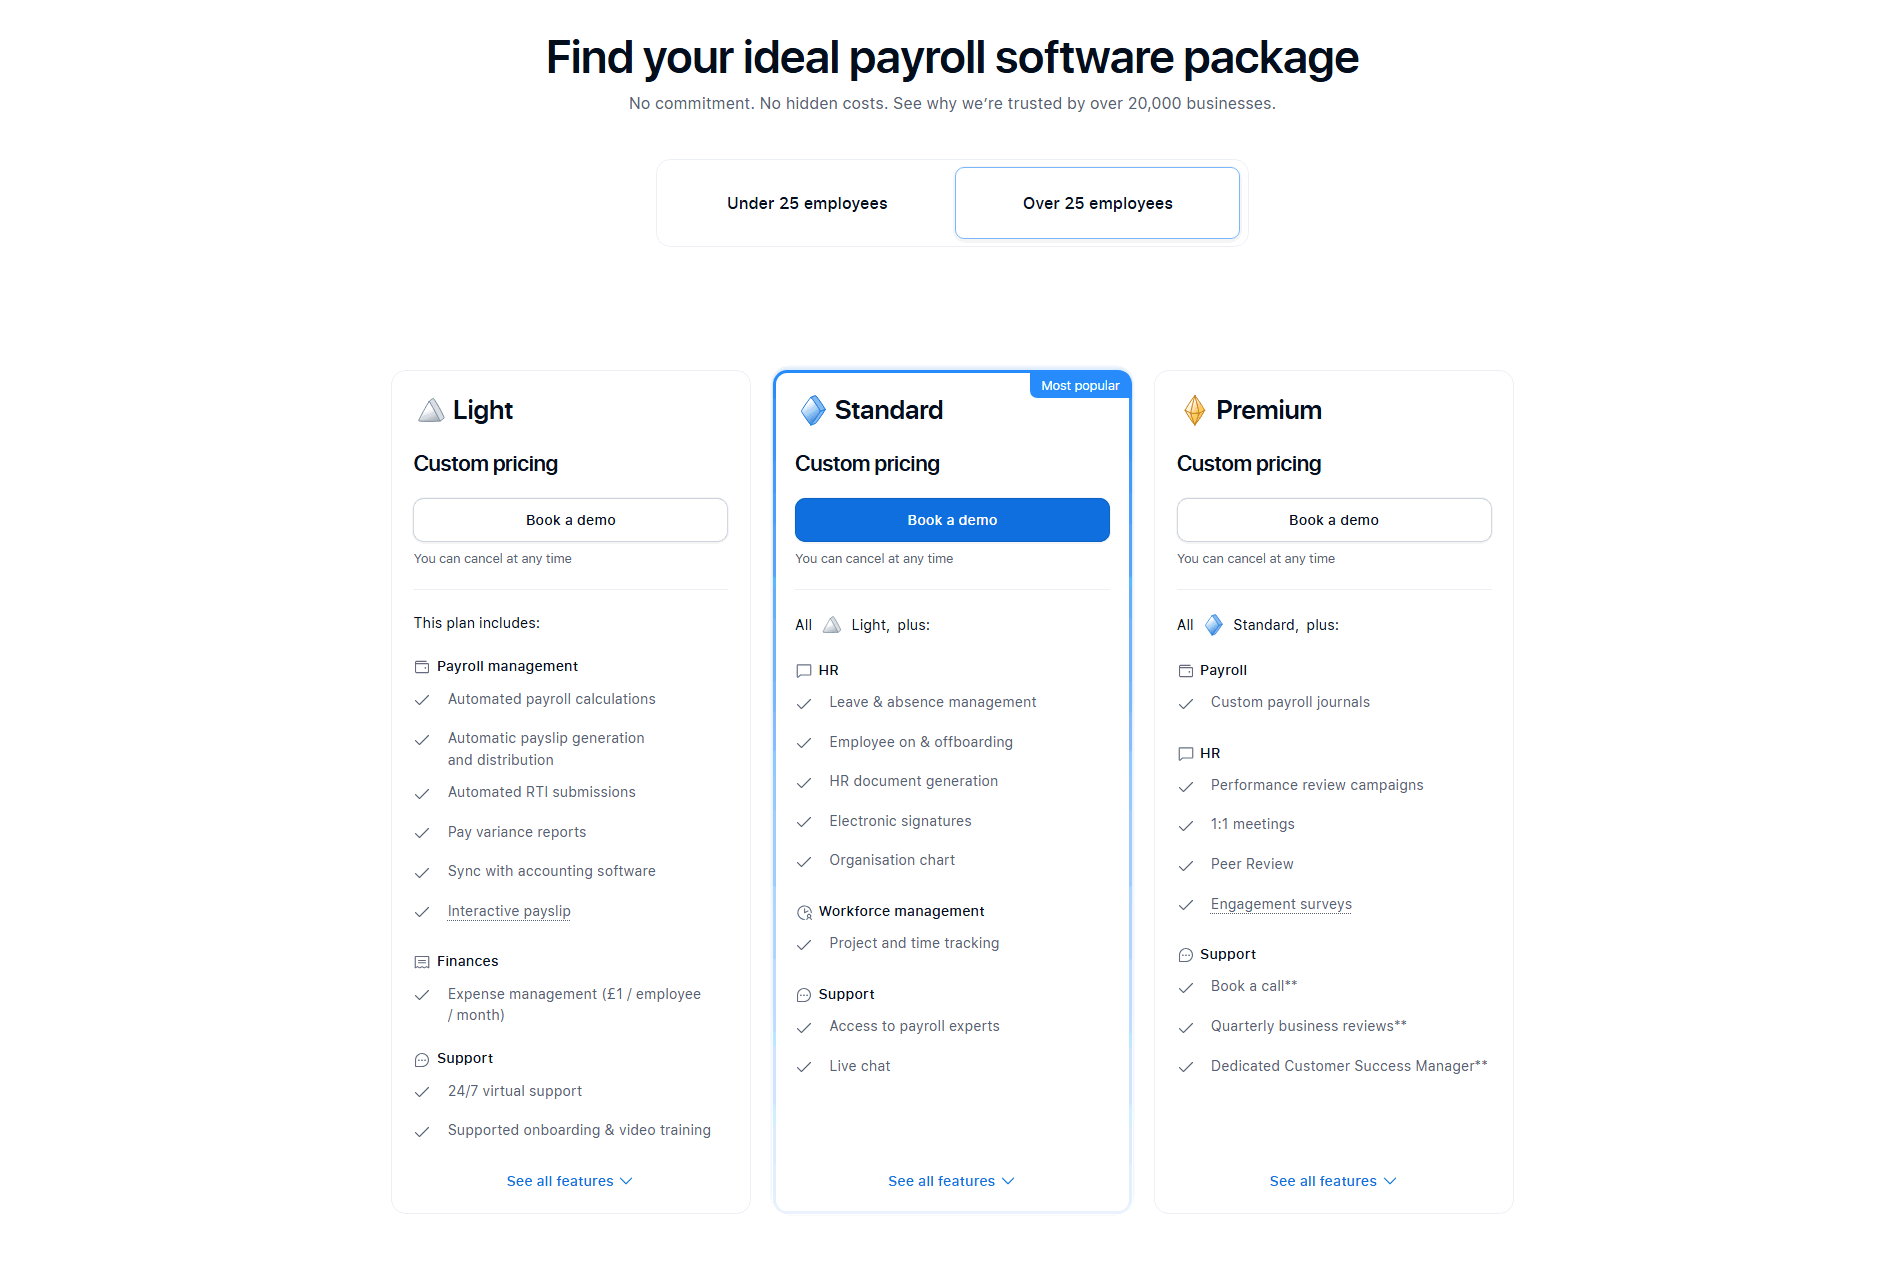
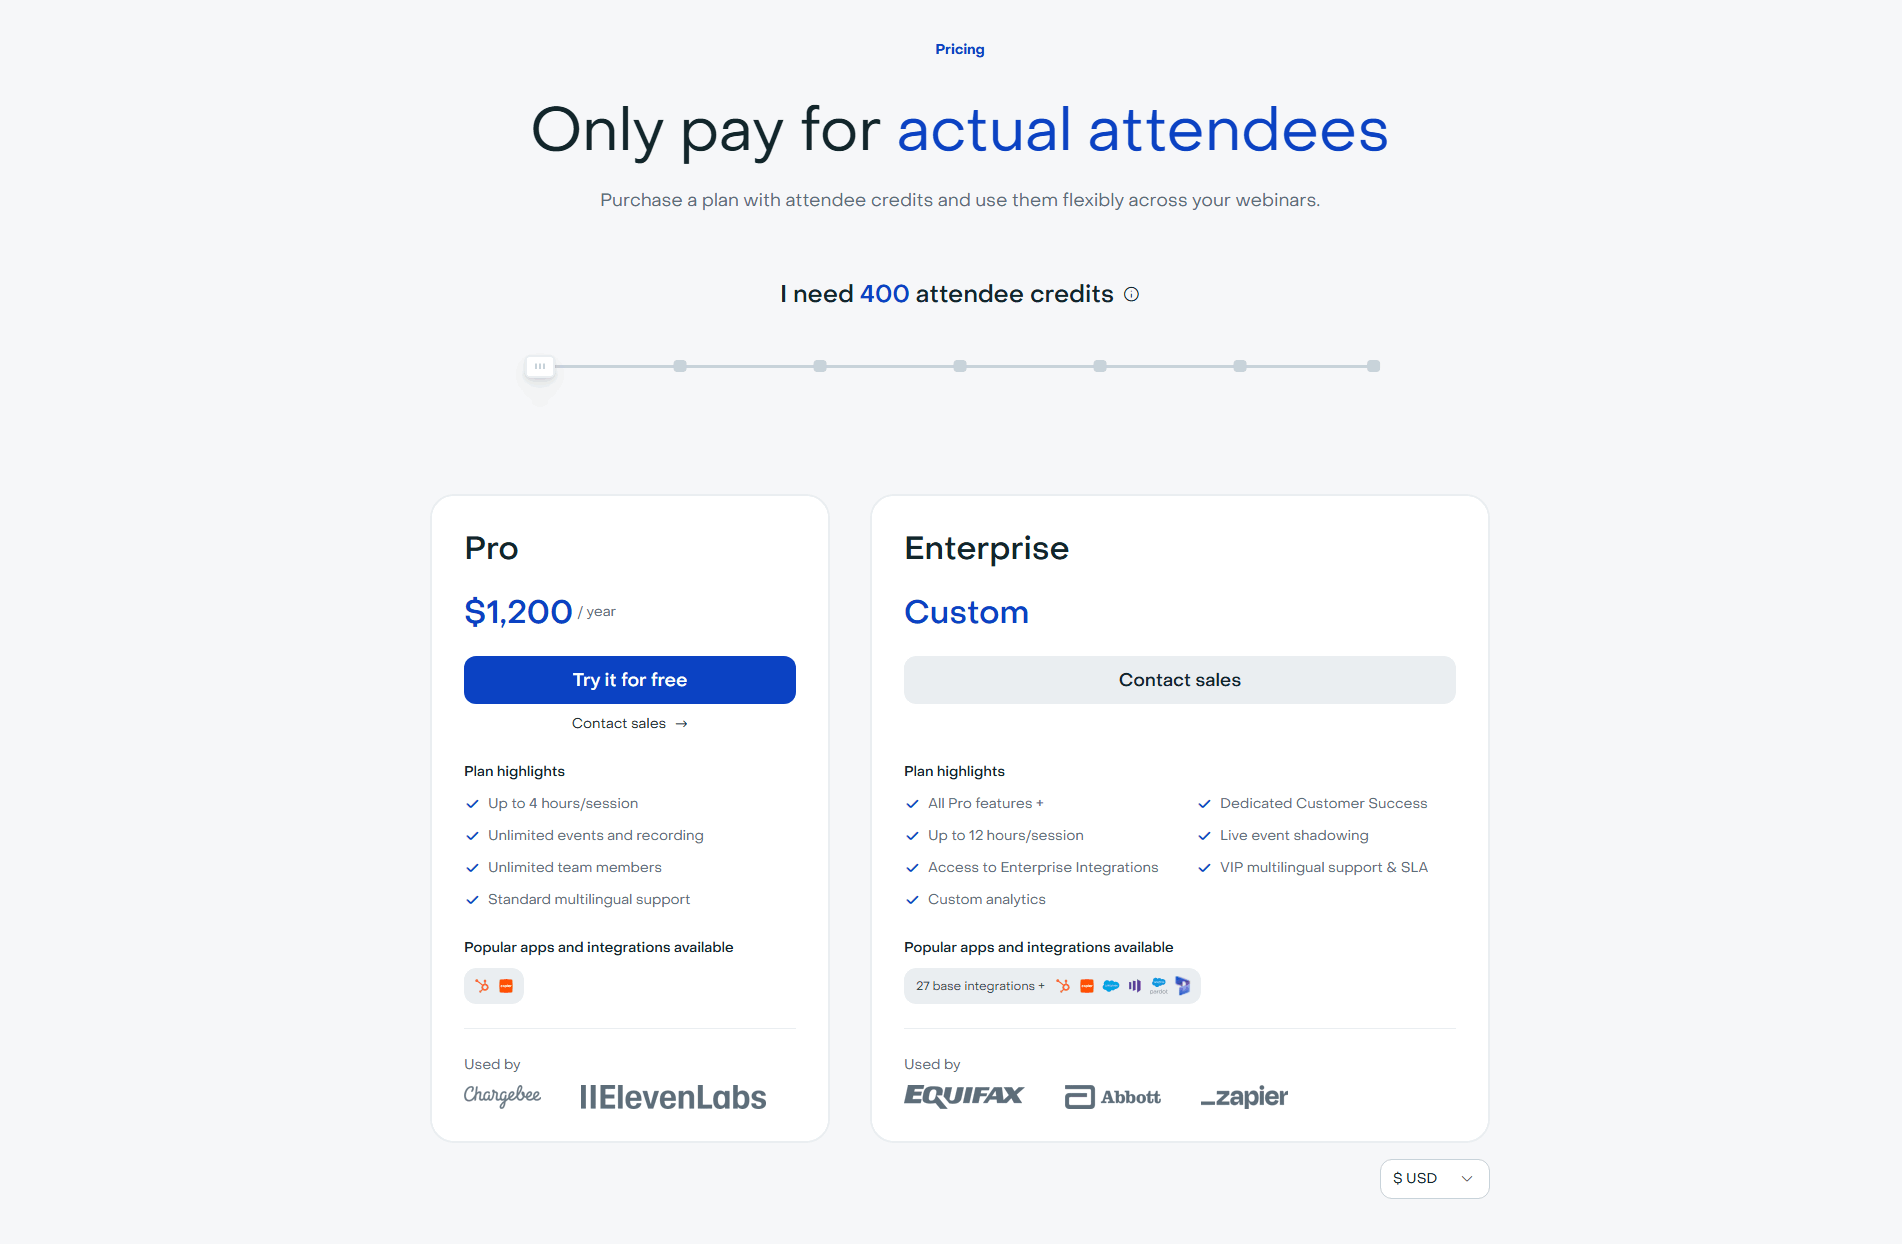
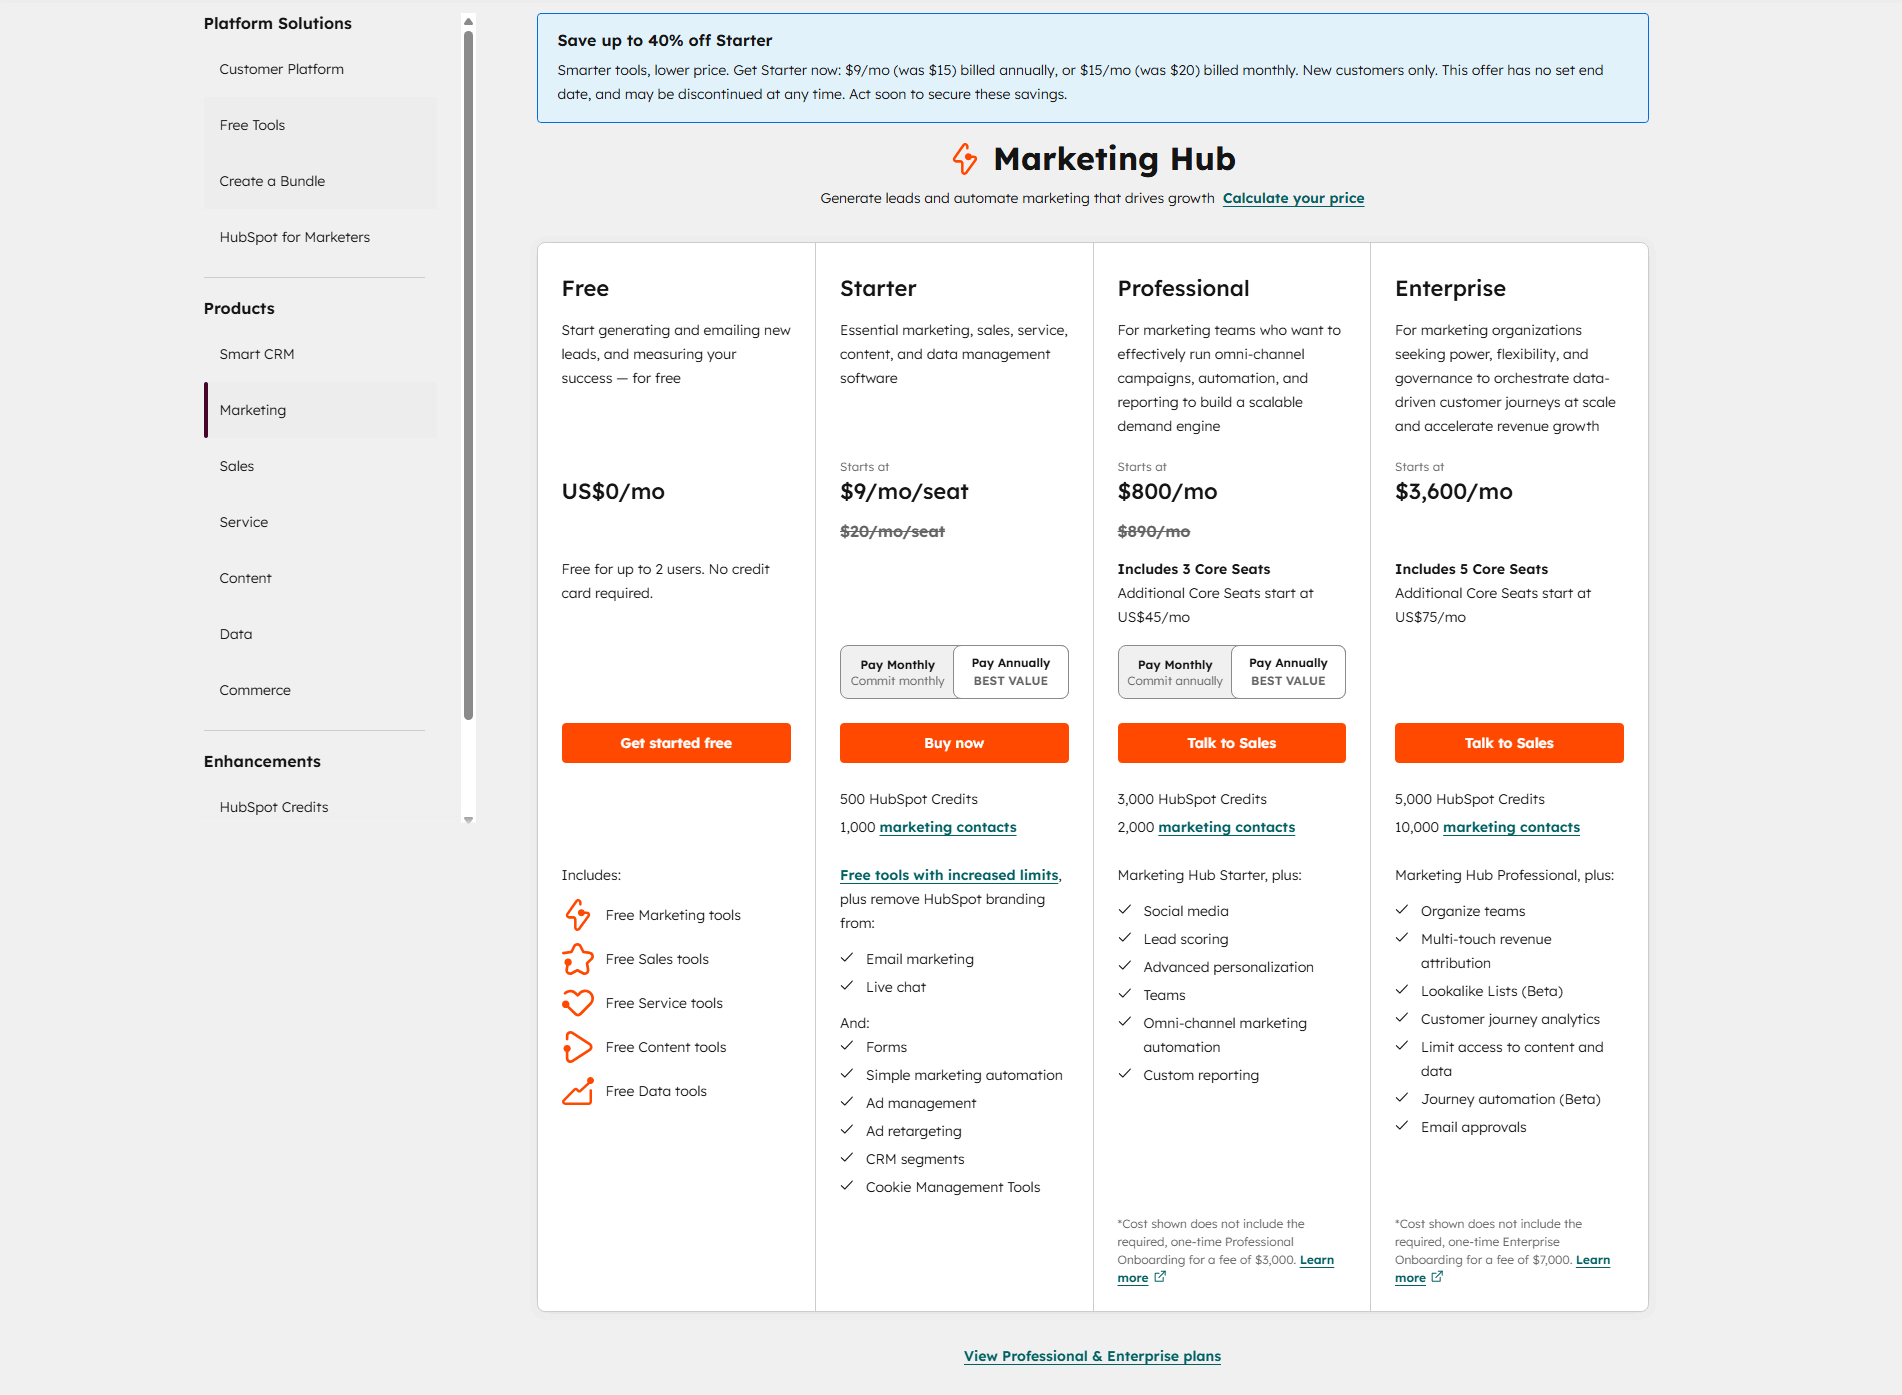
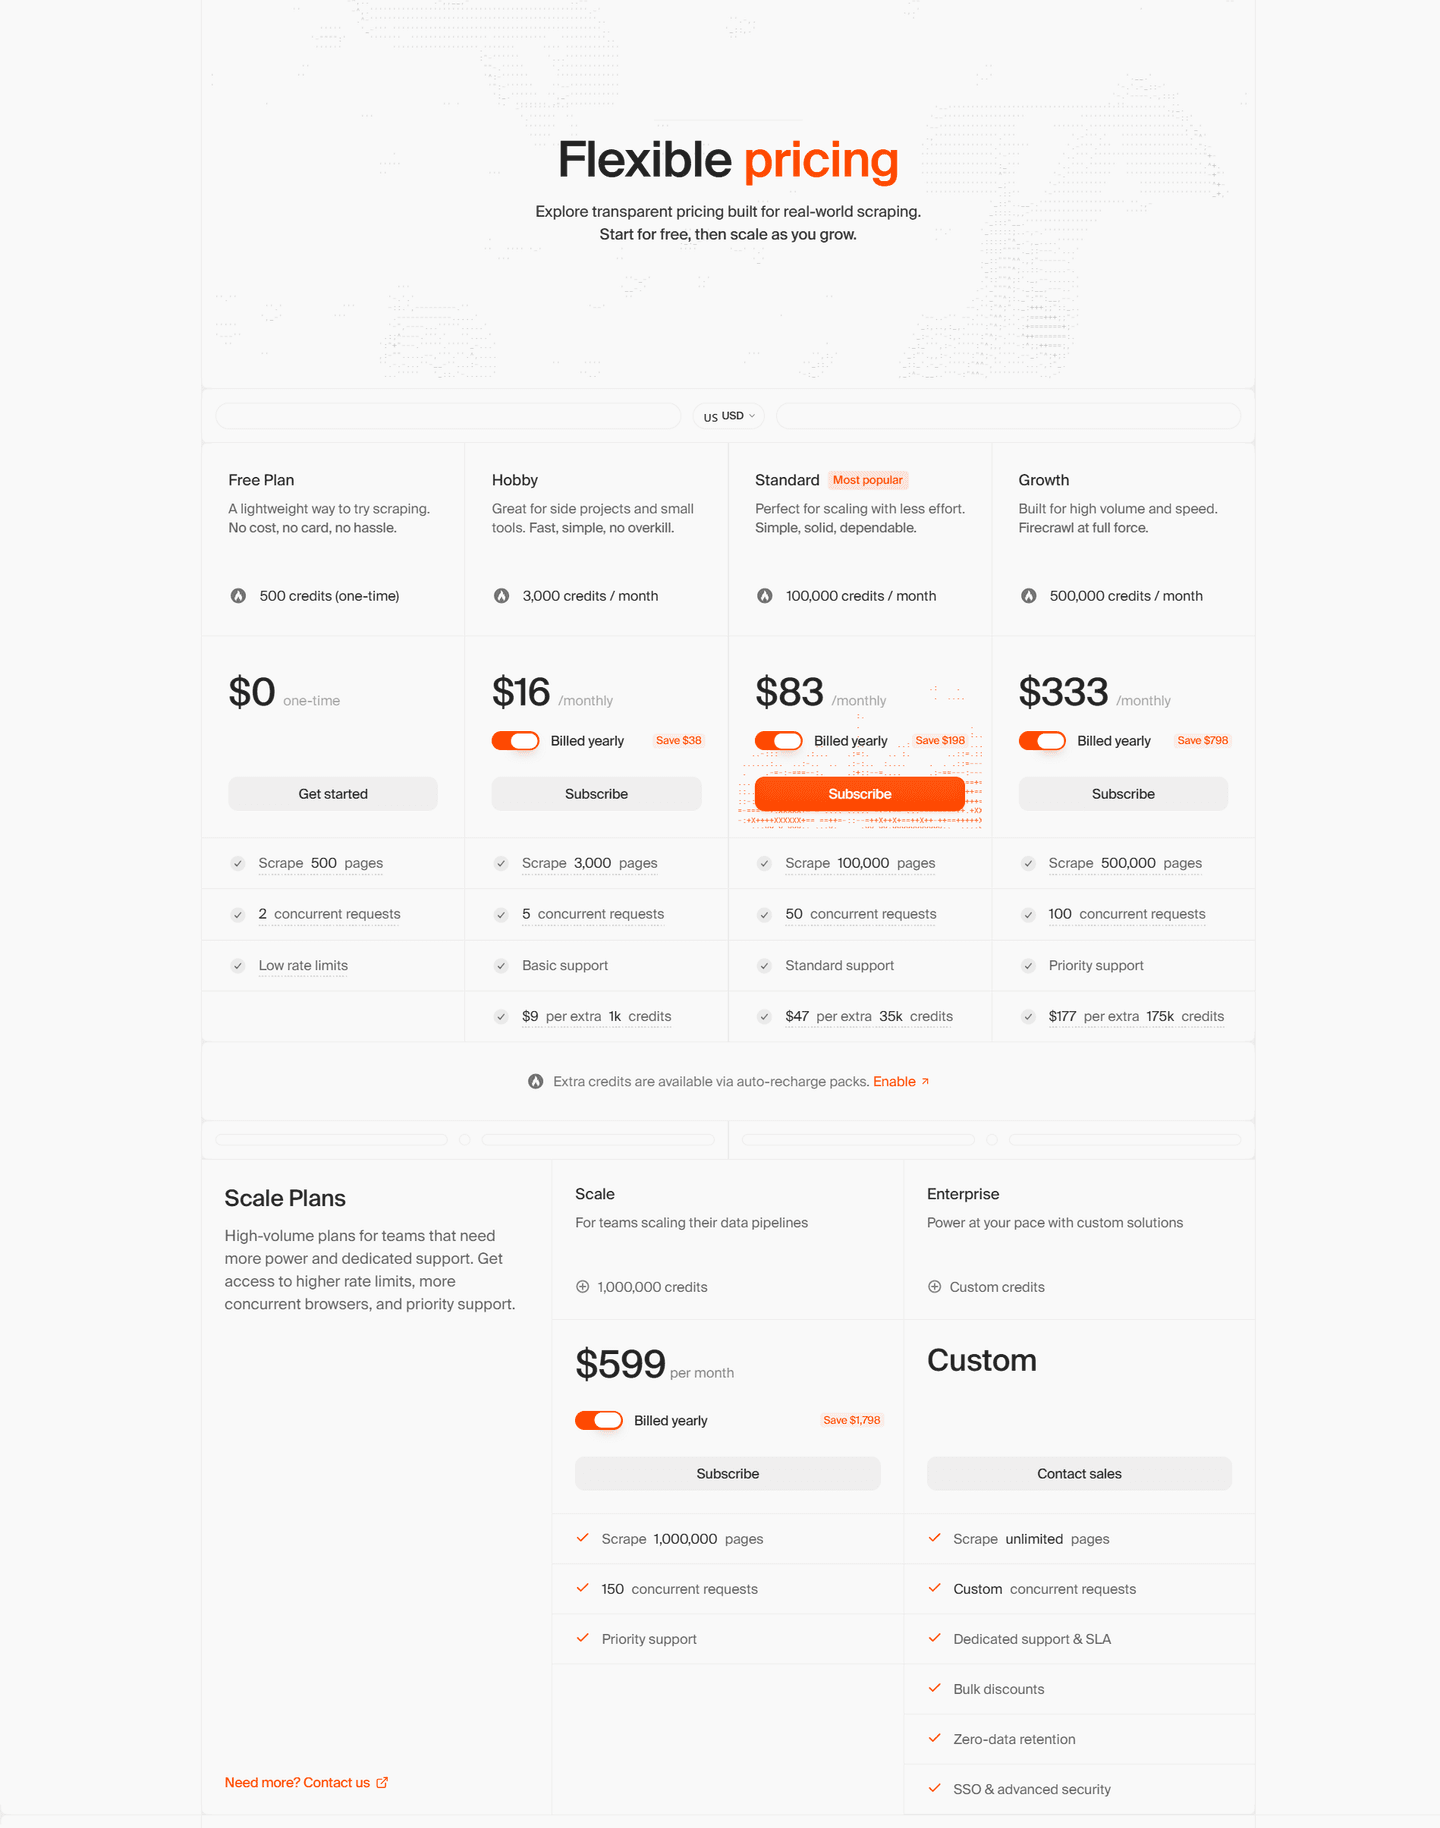
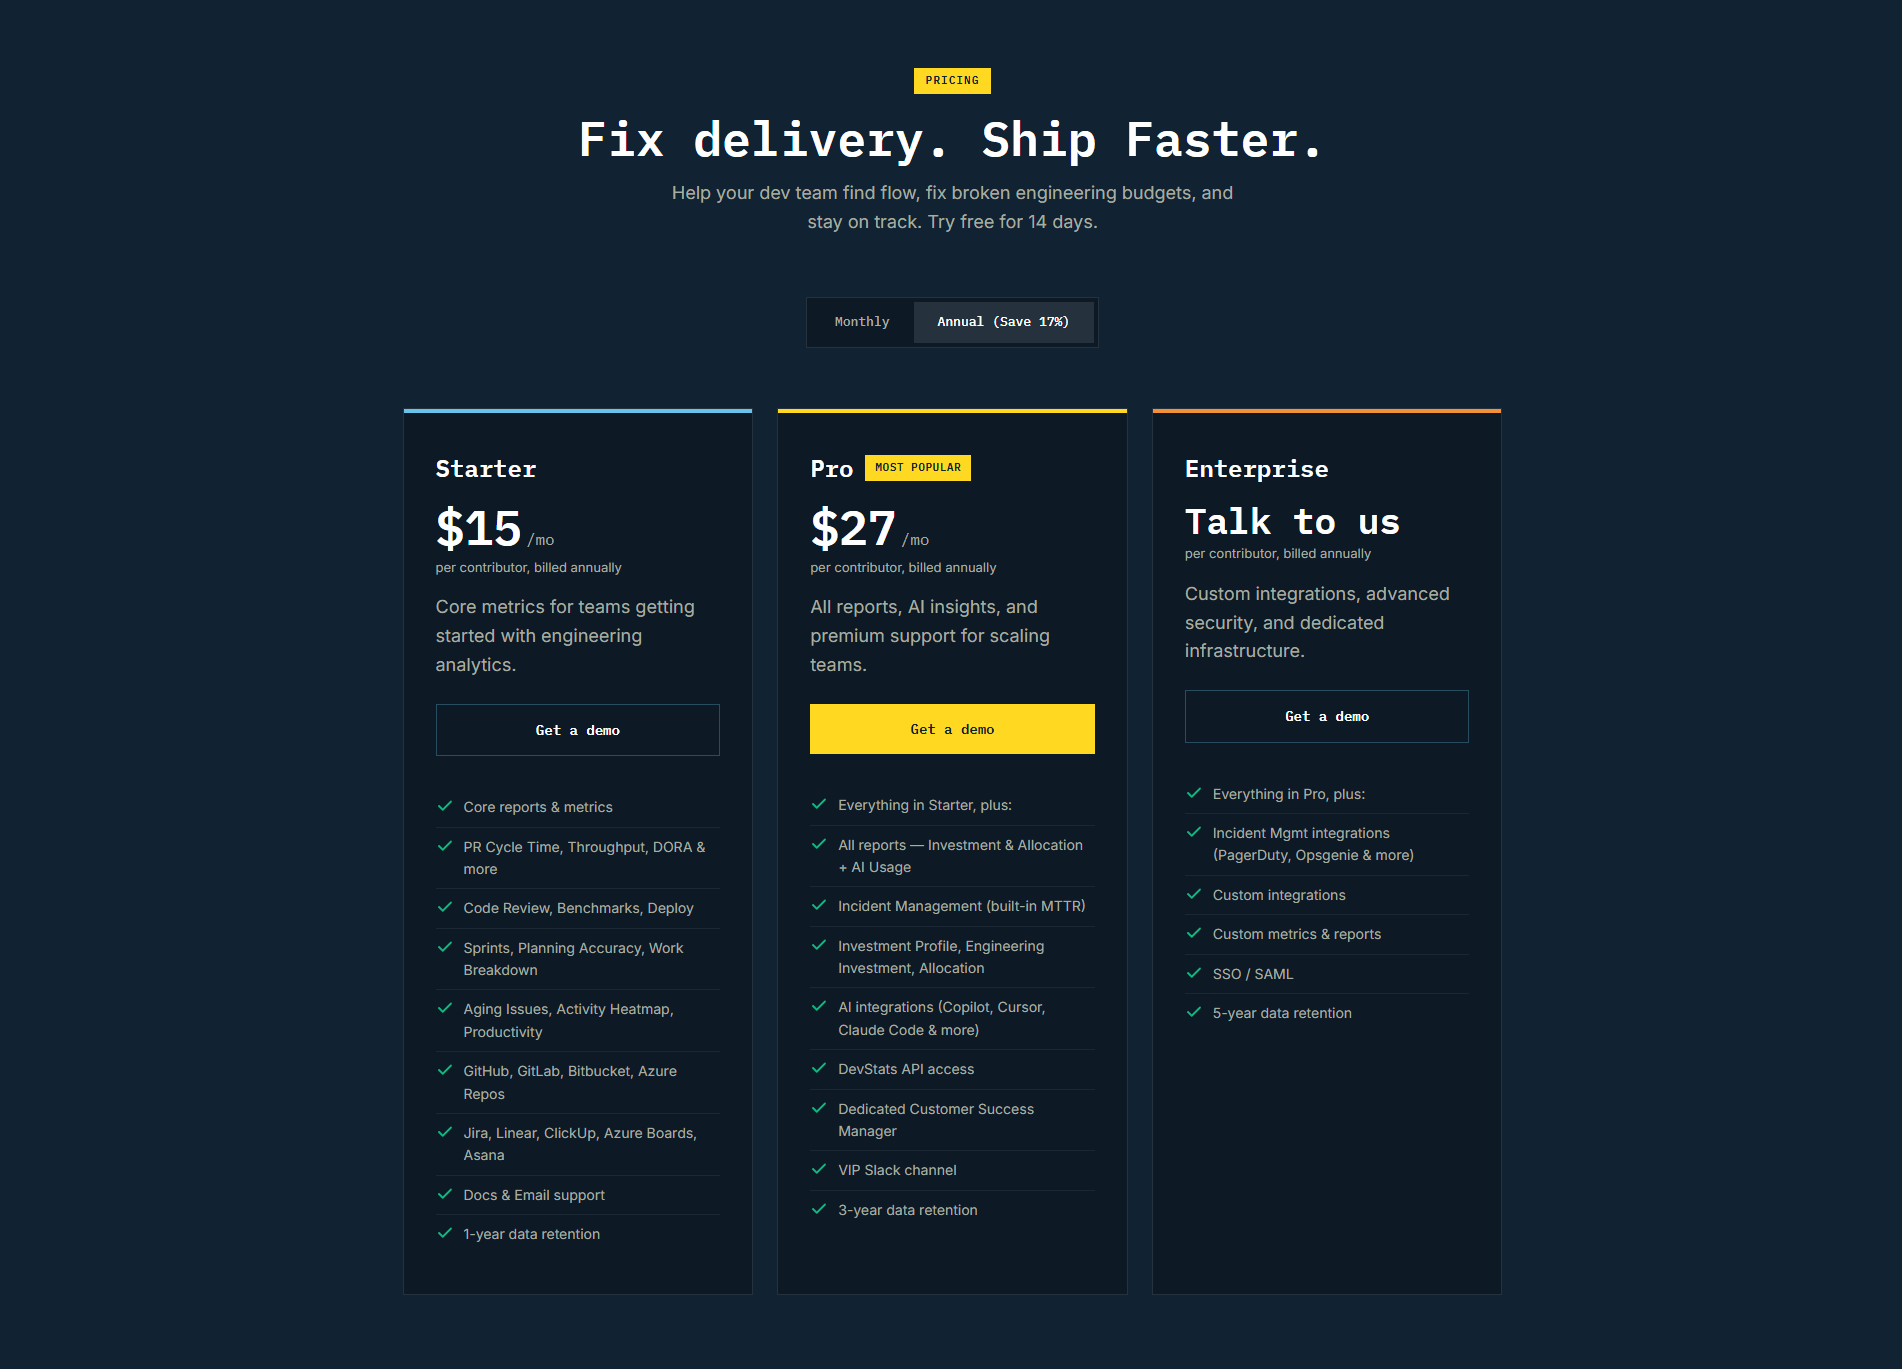
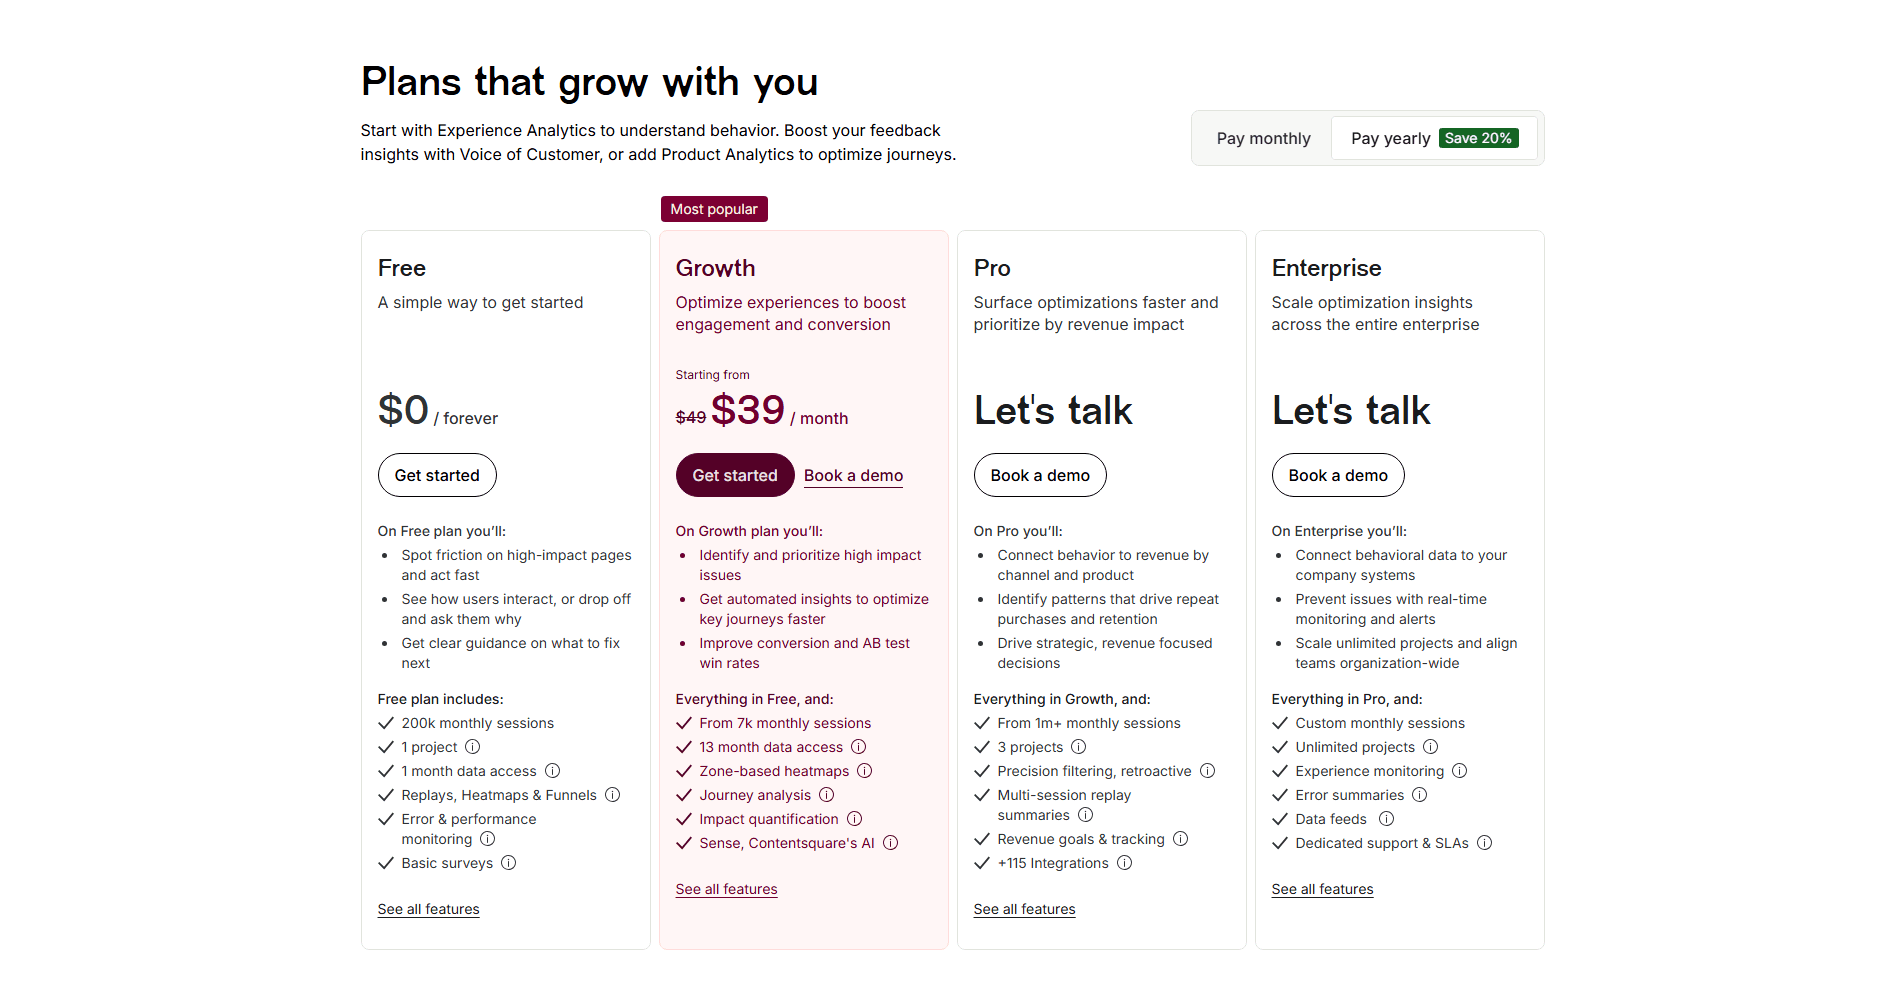
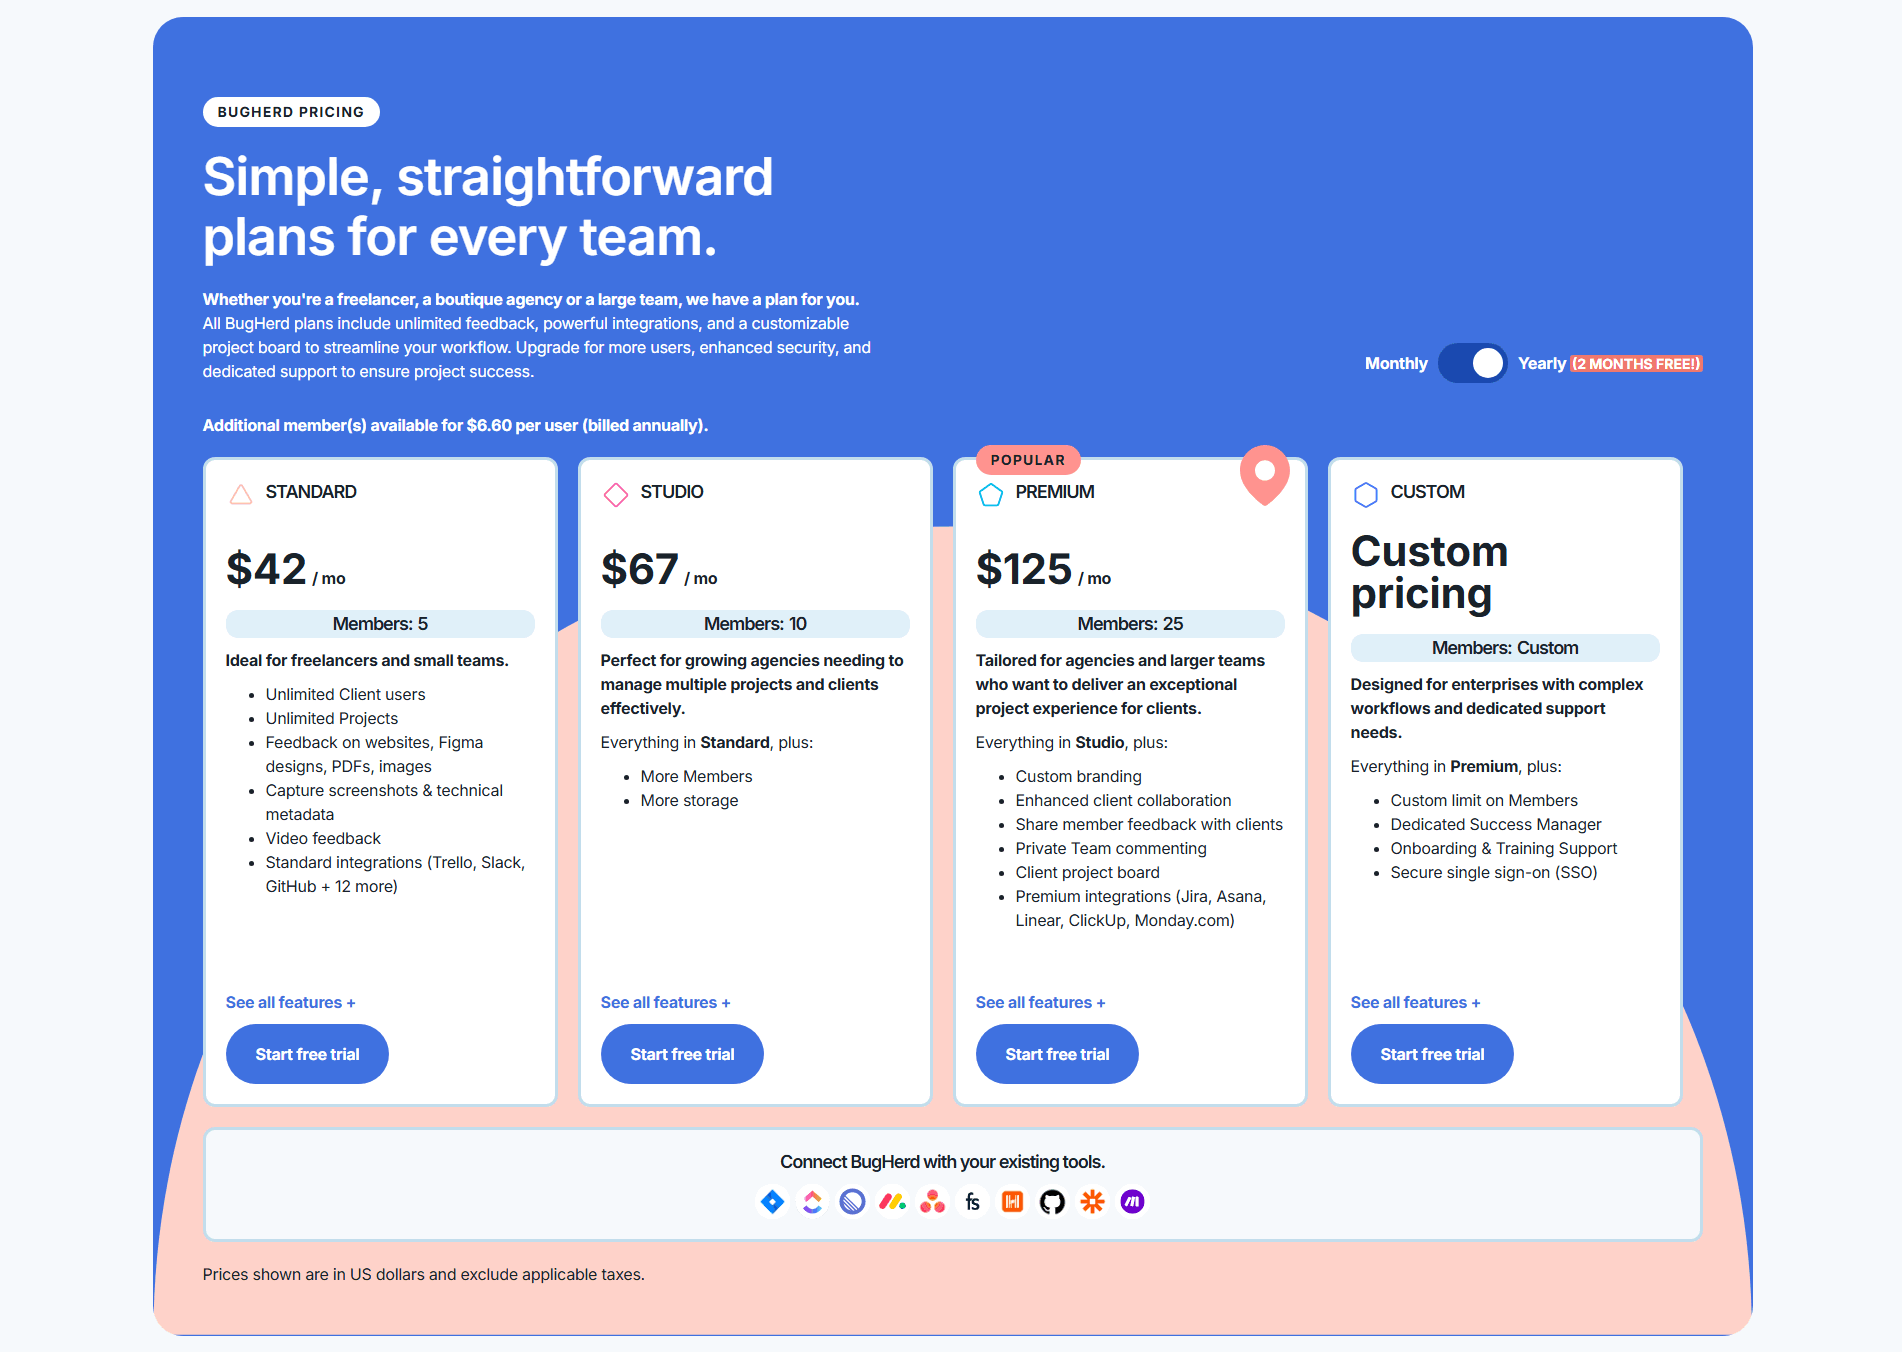
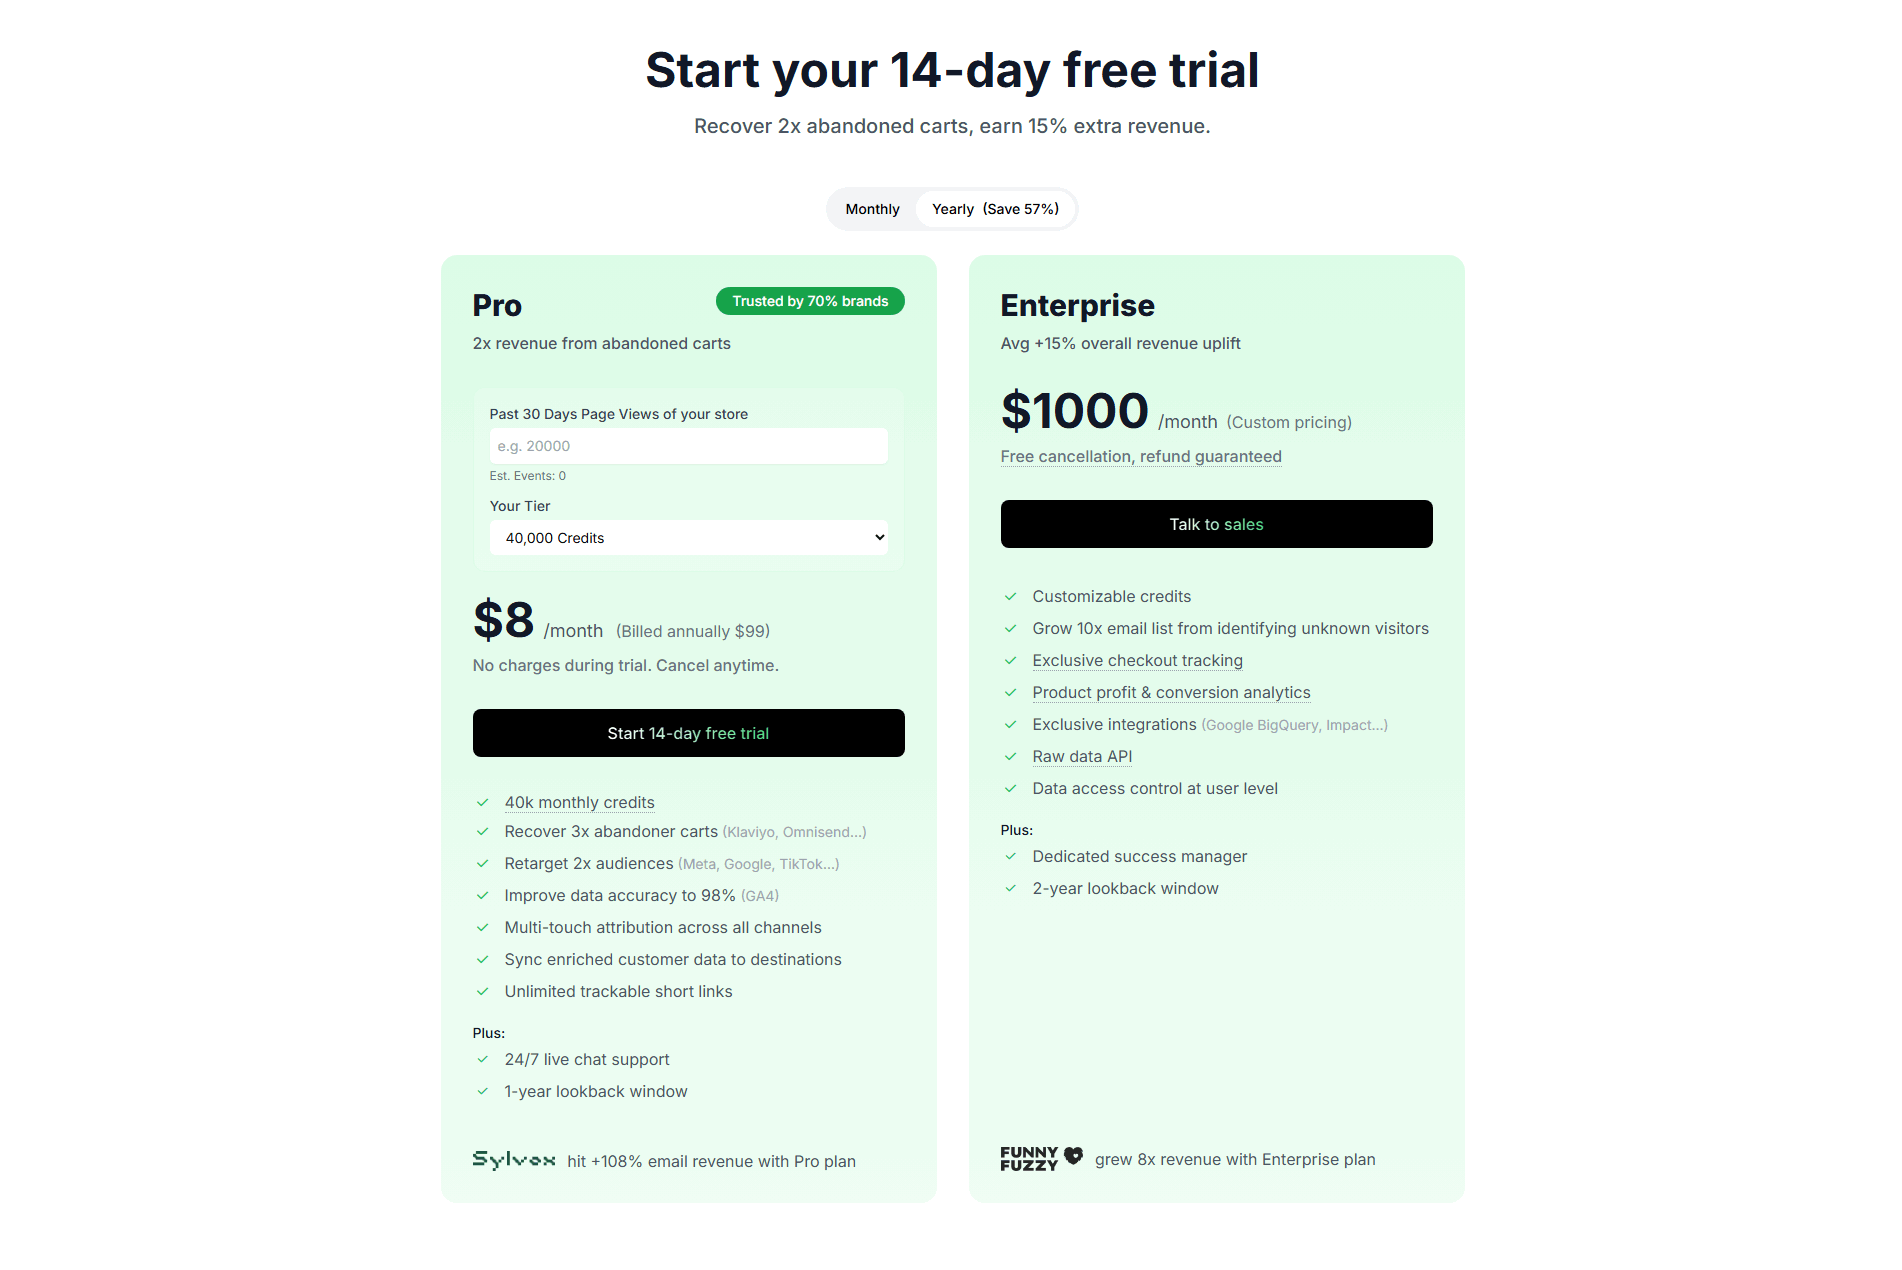
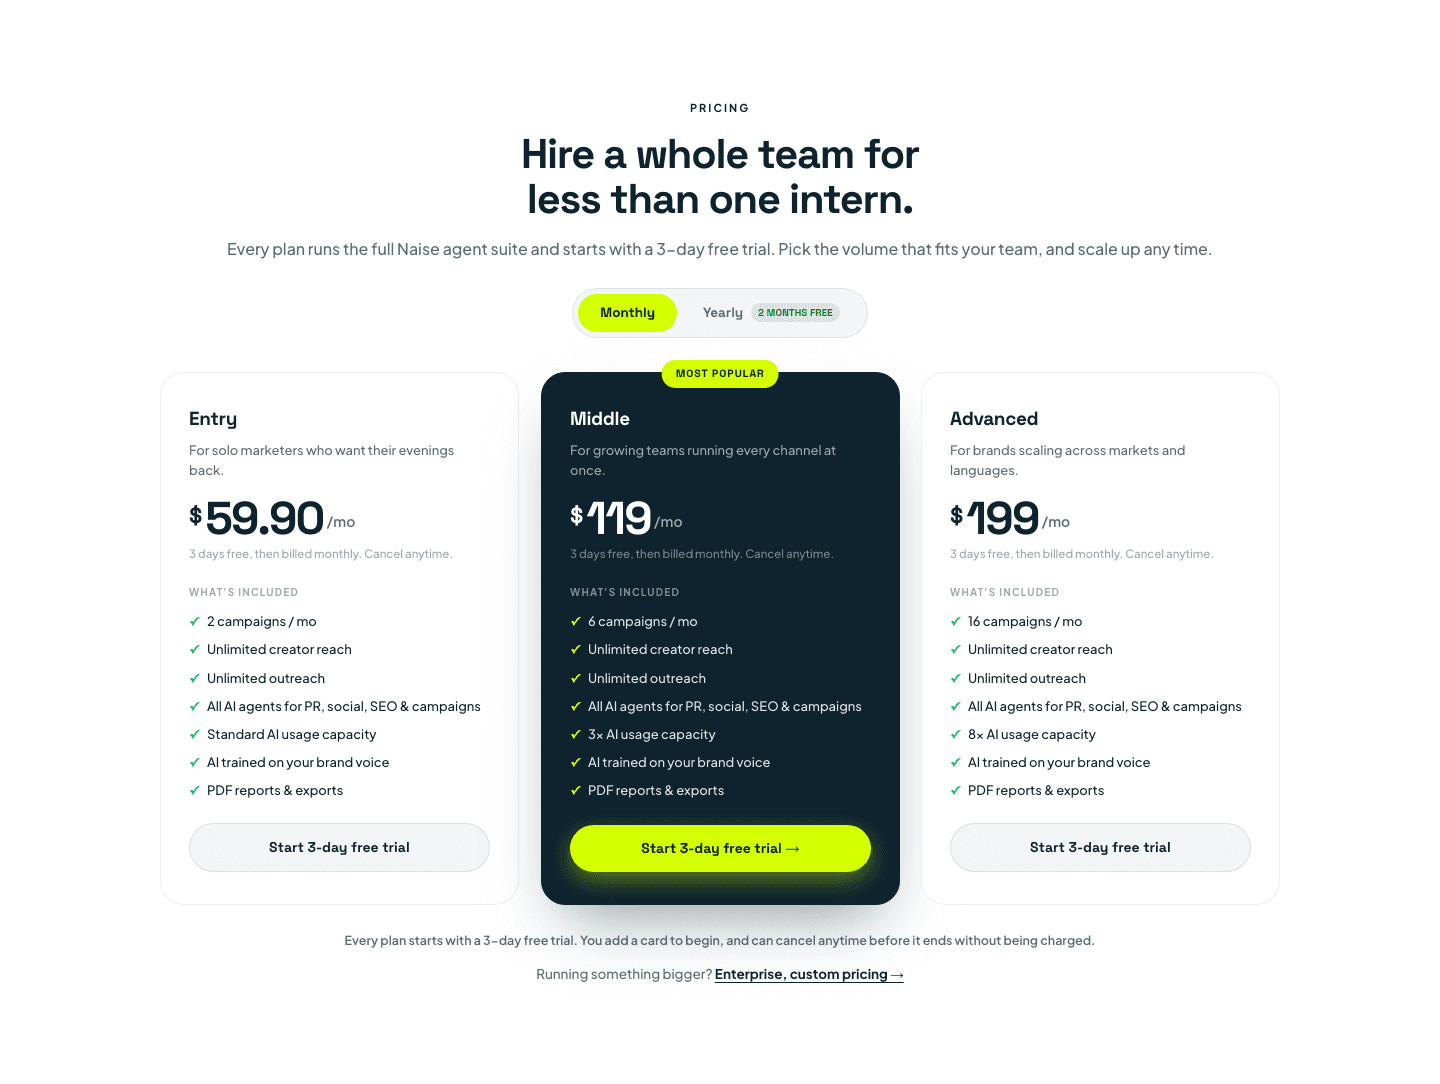
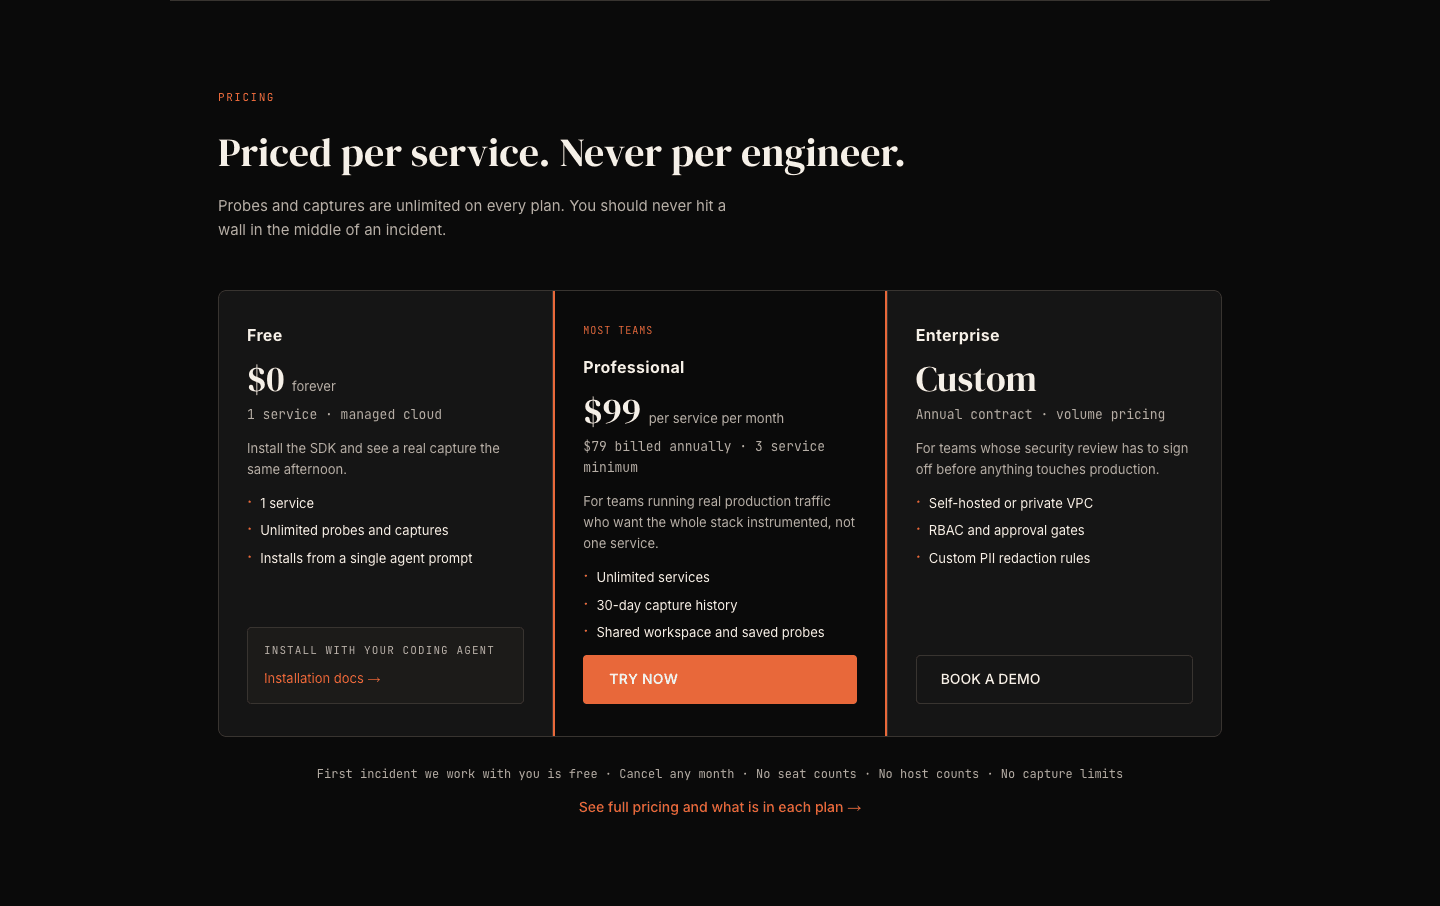
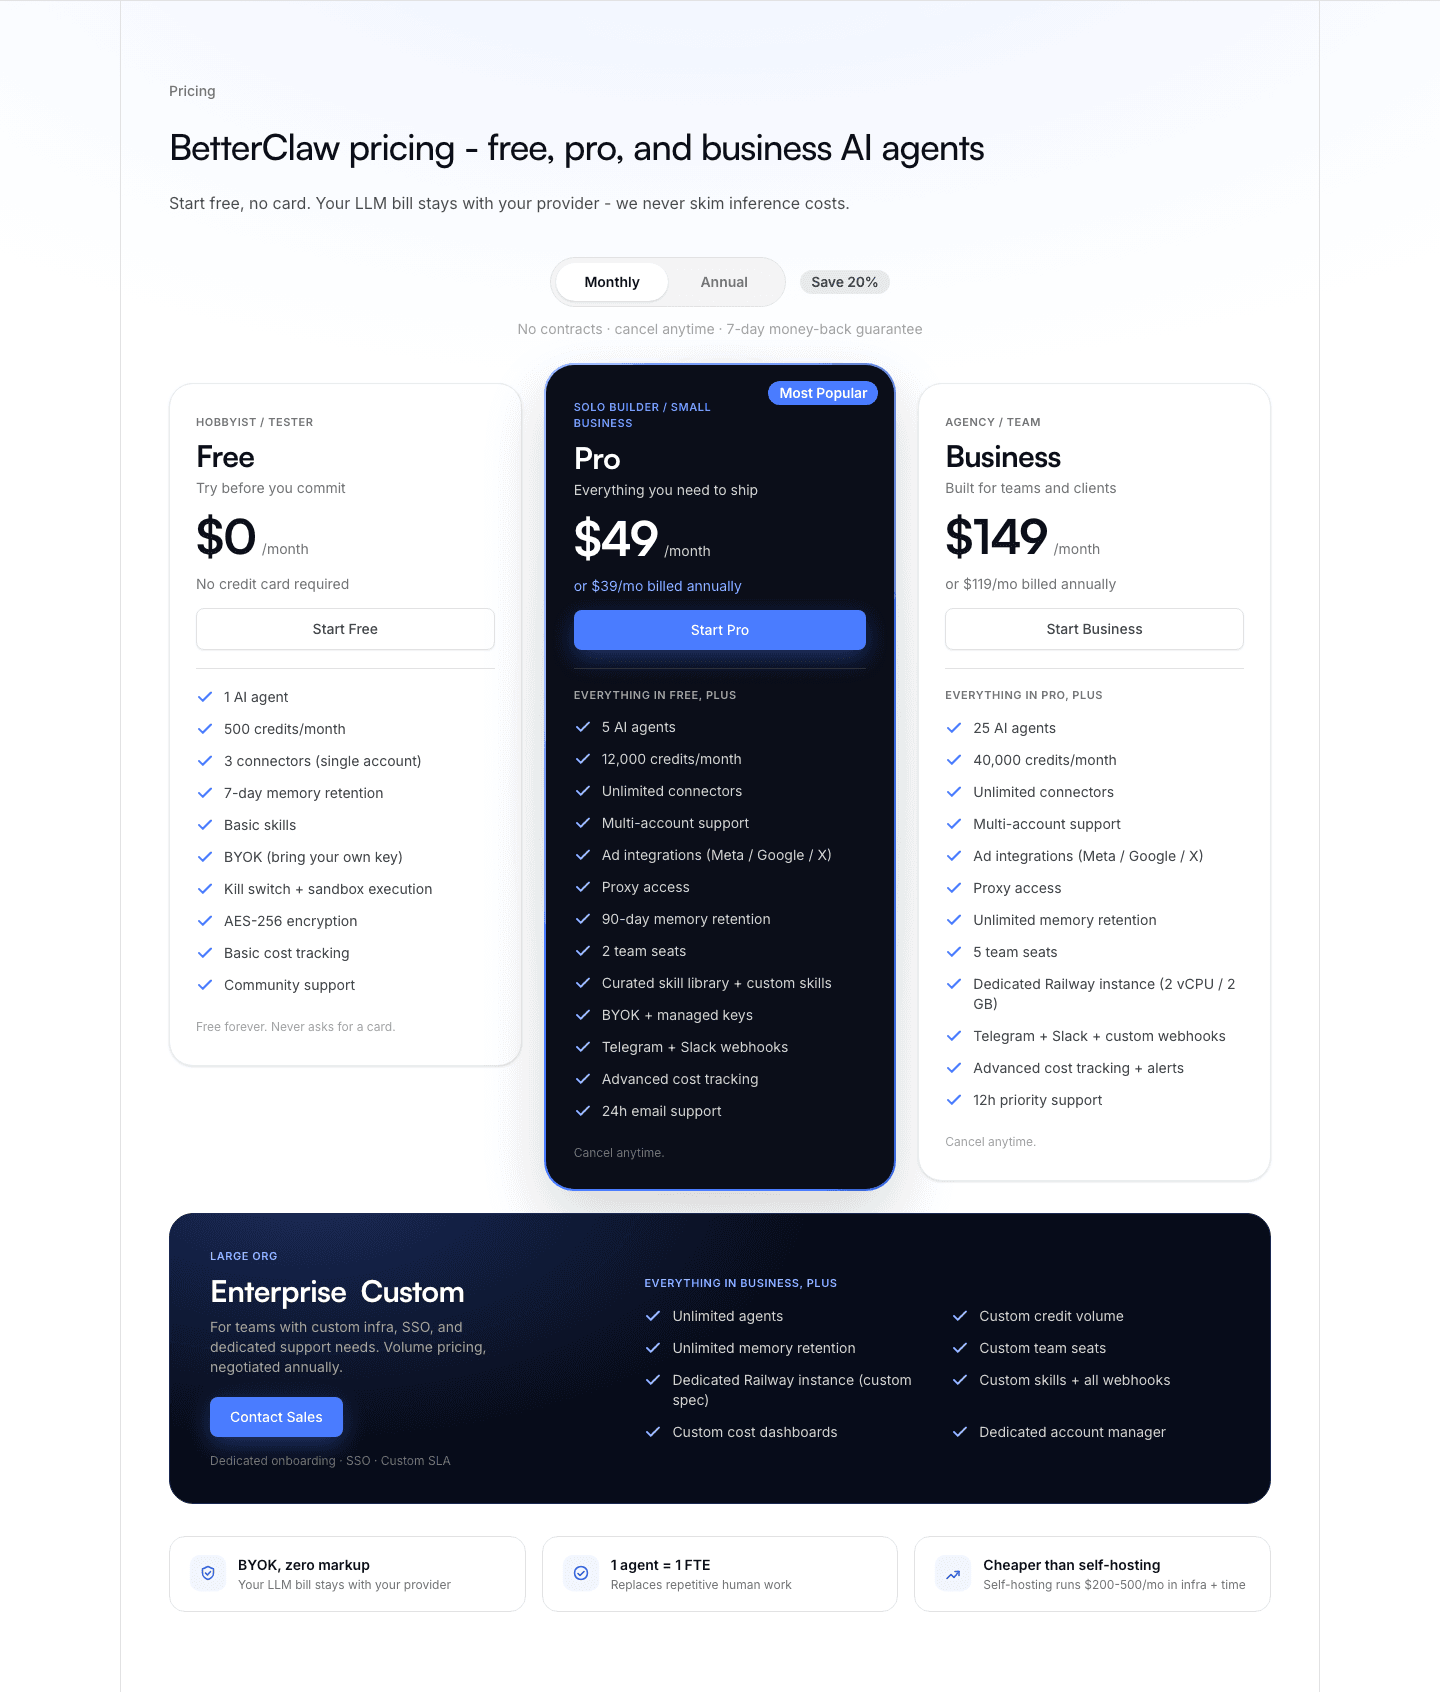
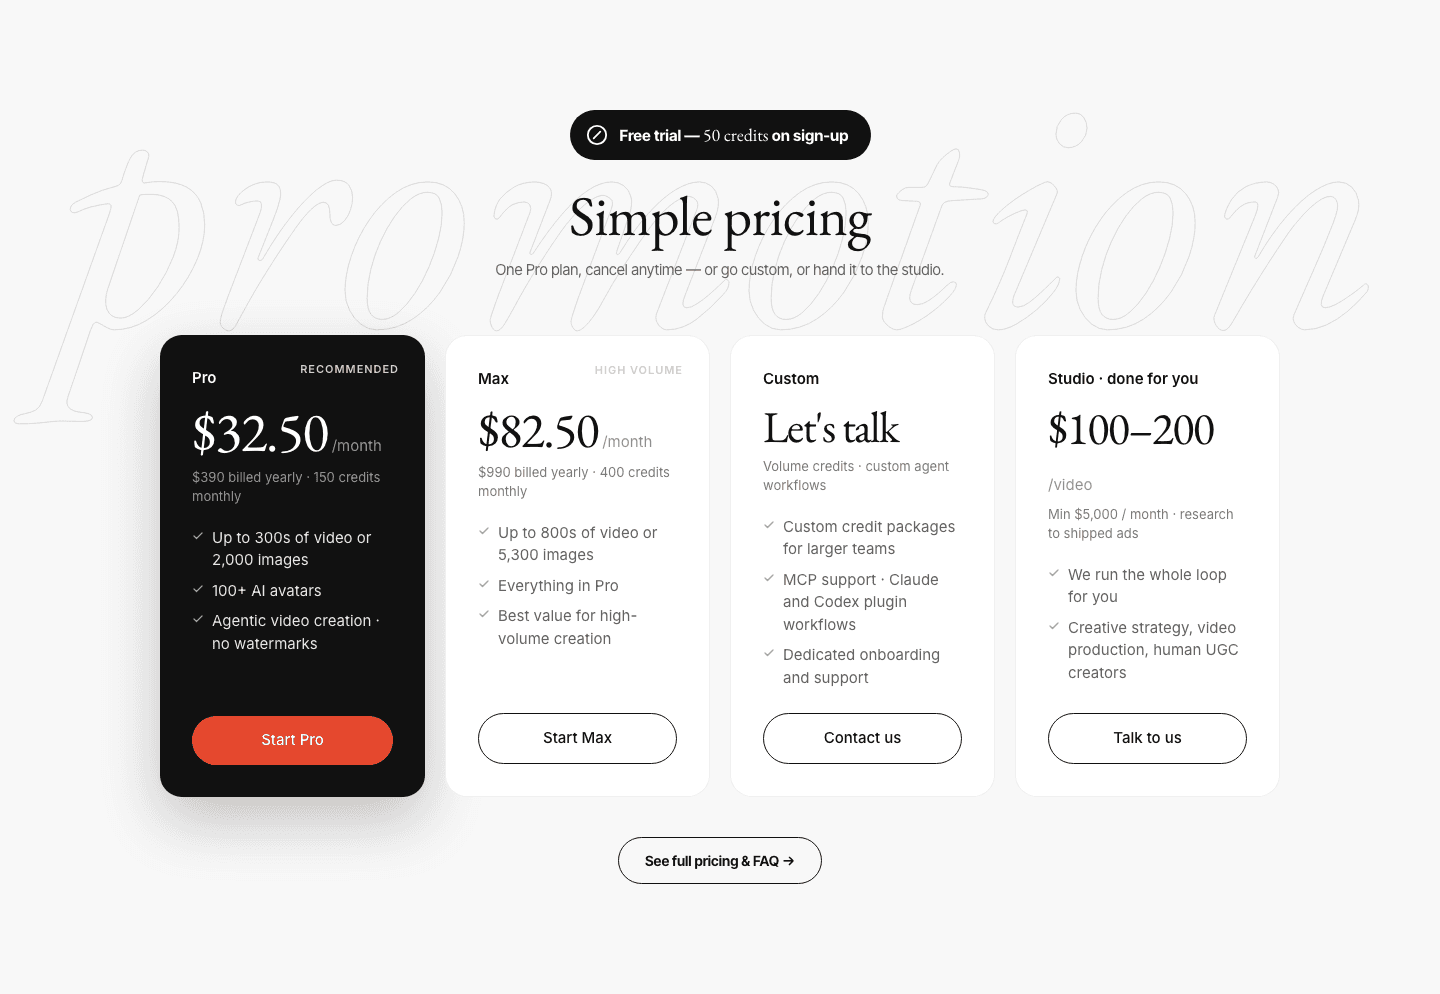
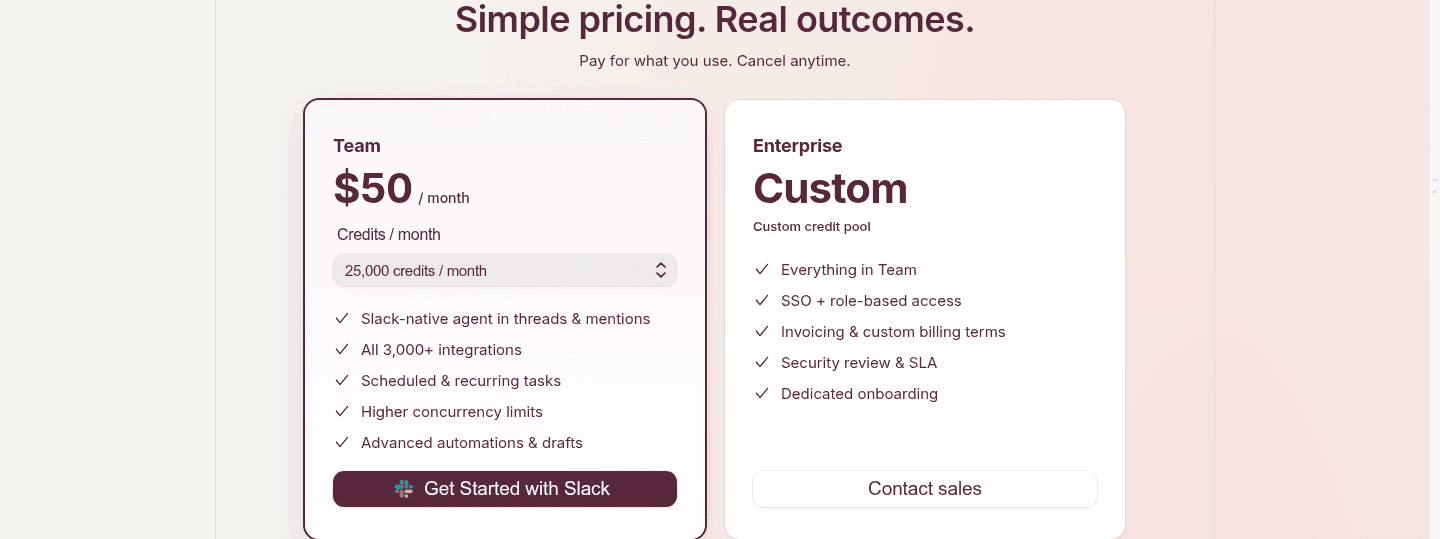
Browse every pricing pattern by UX best practice.
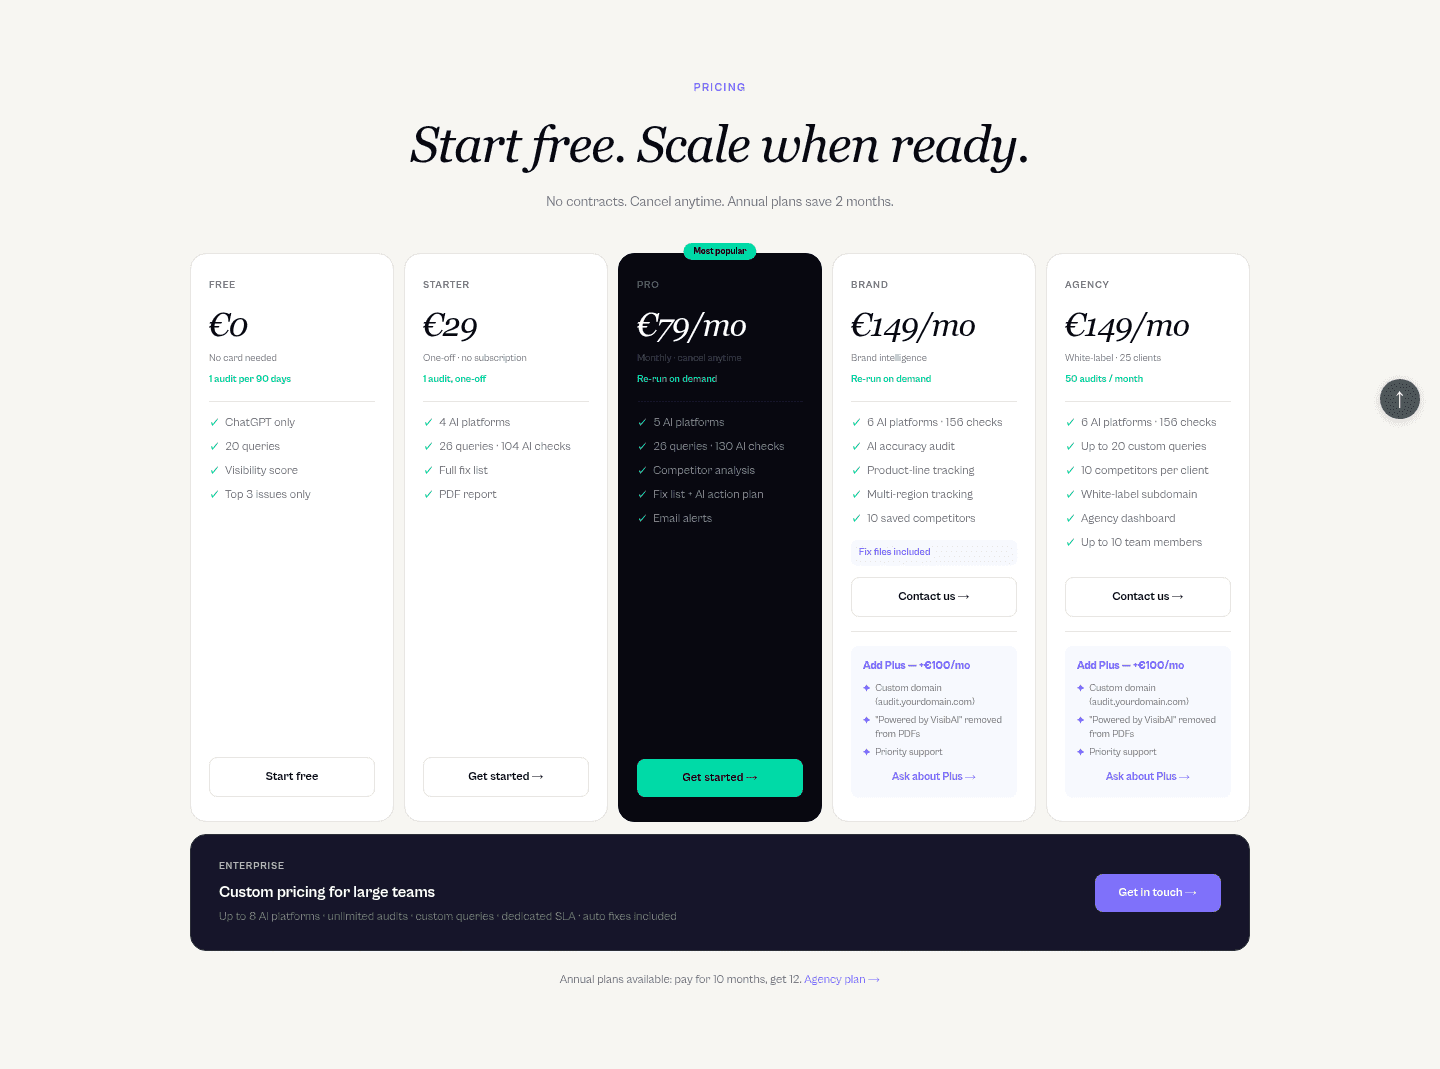
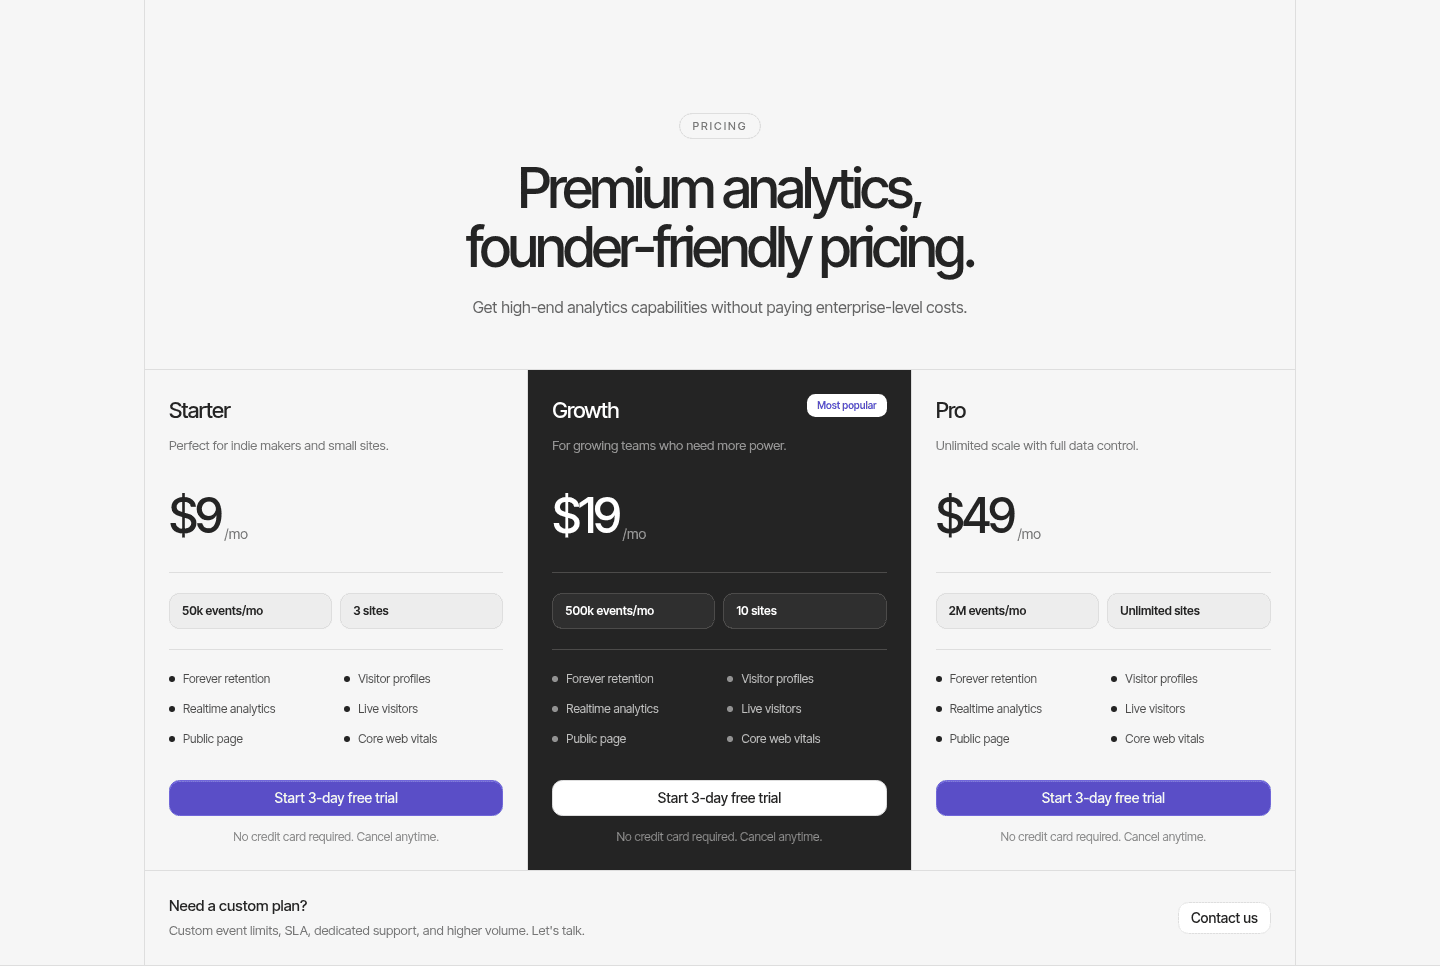
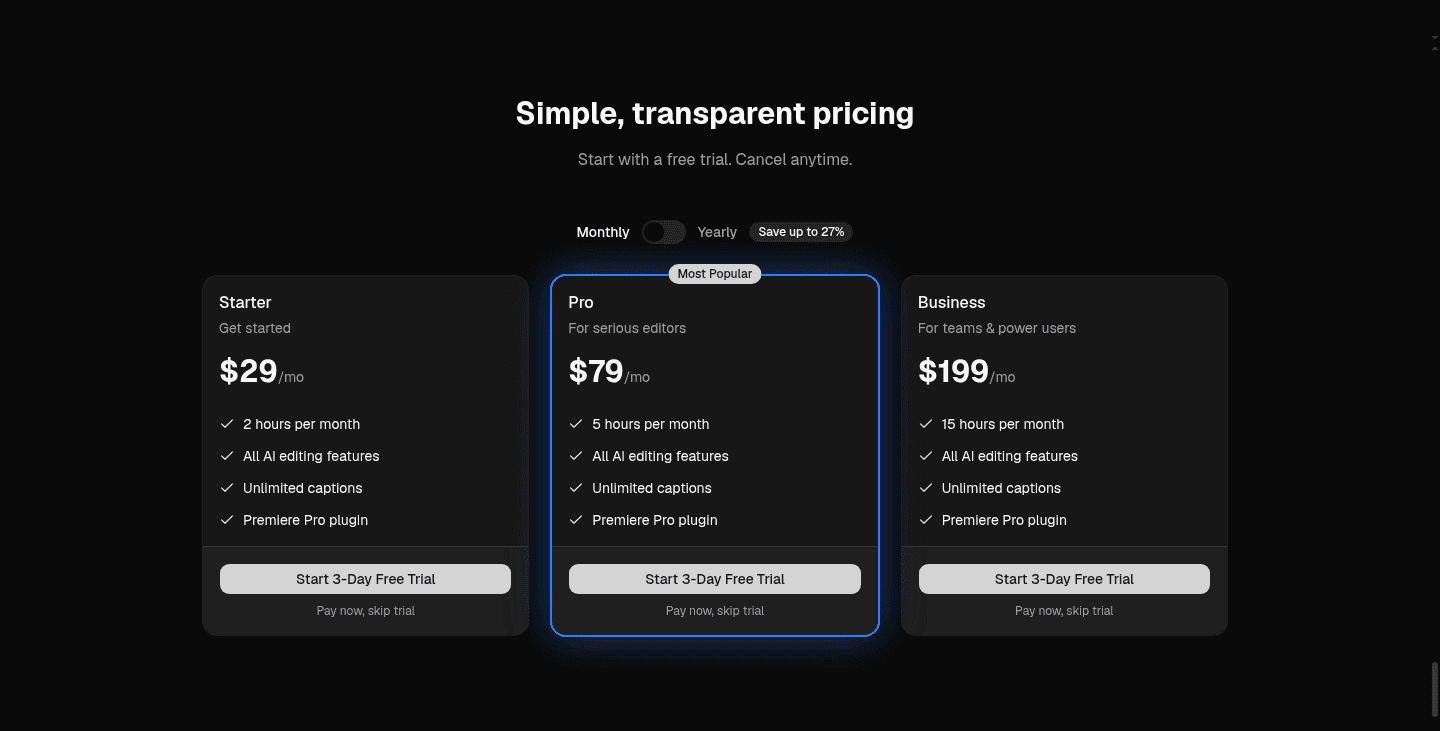
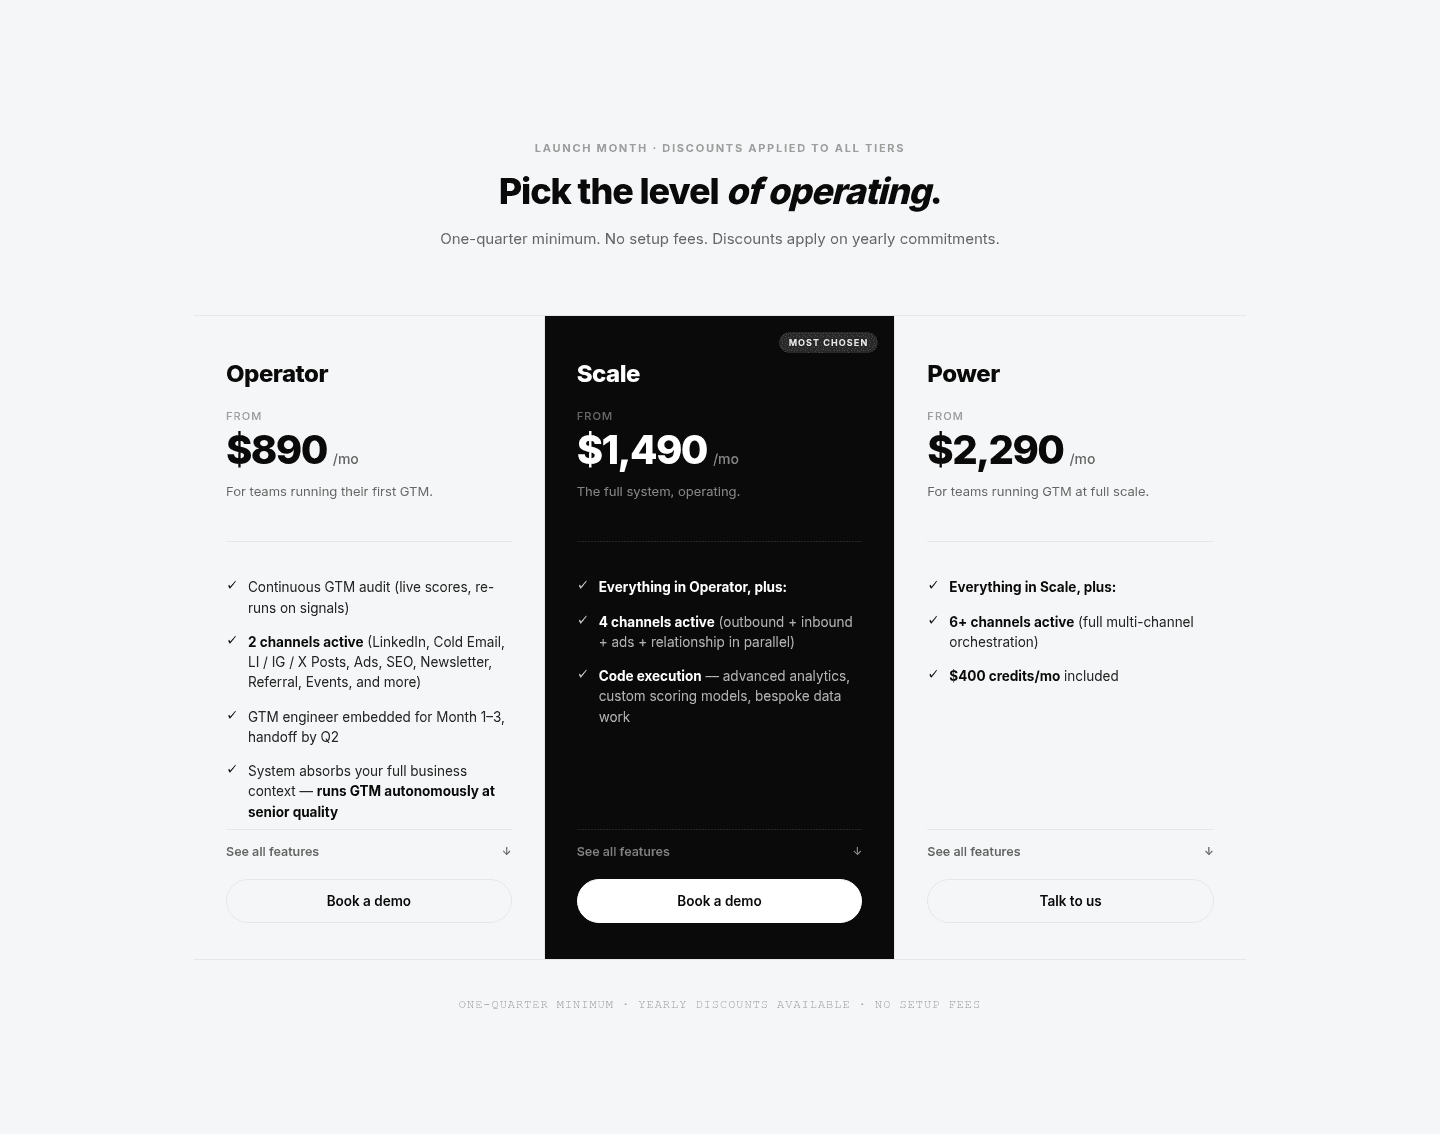
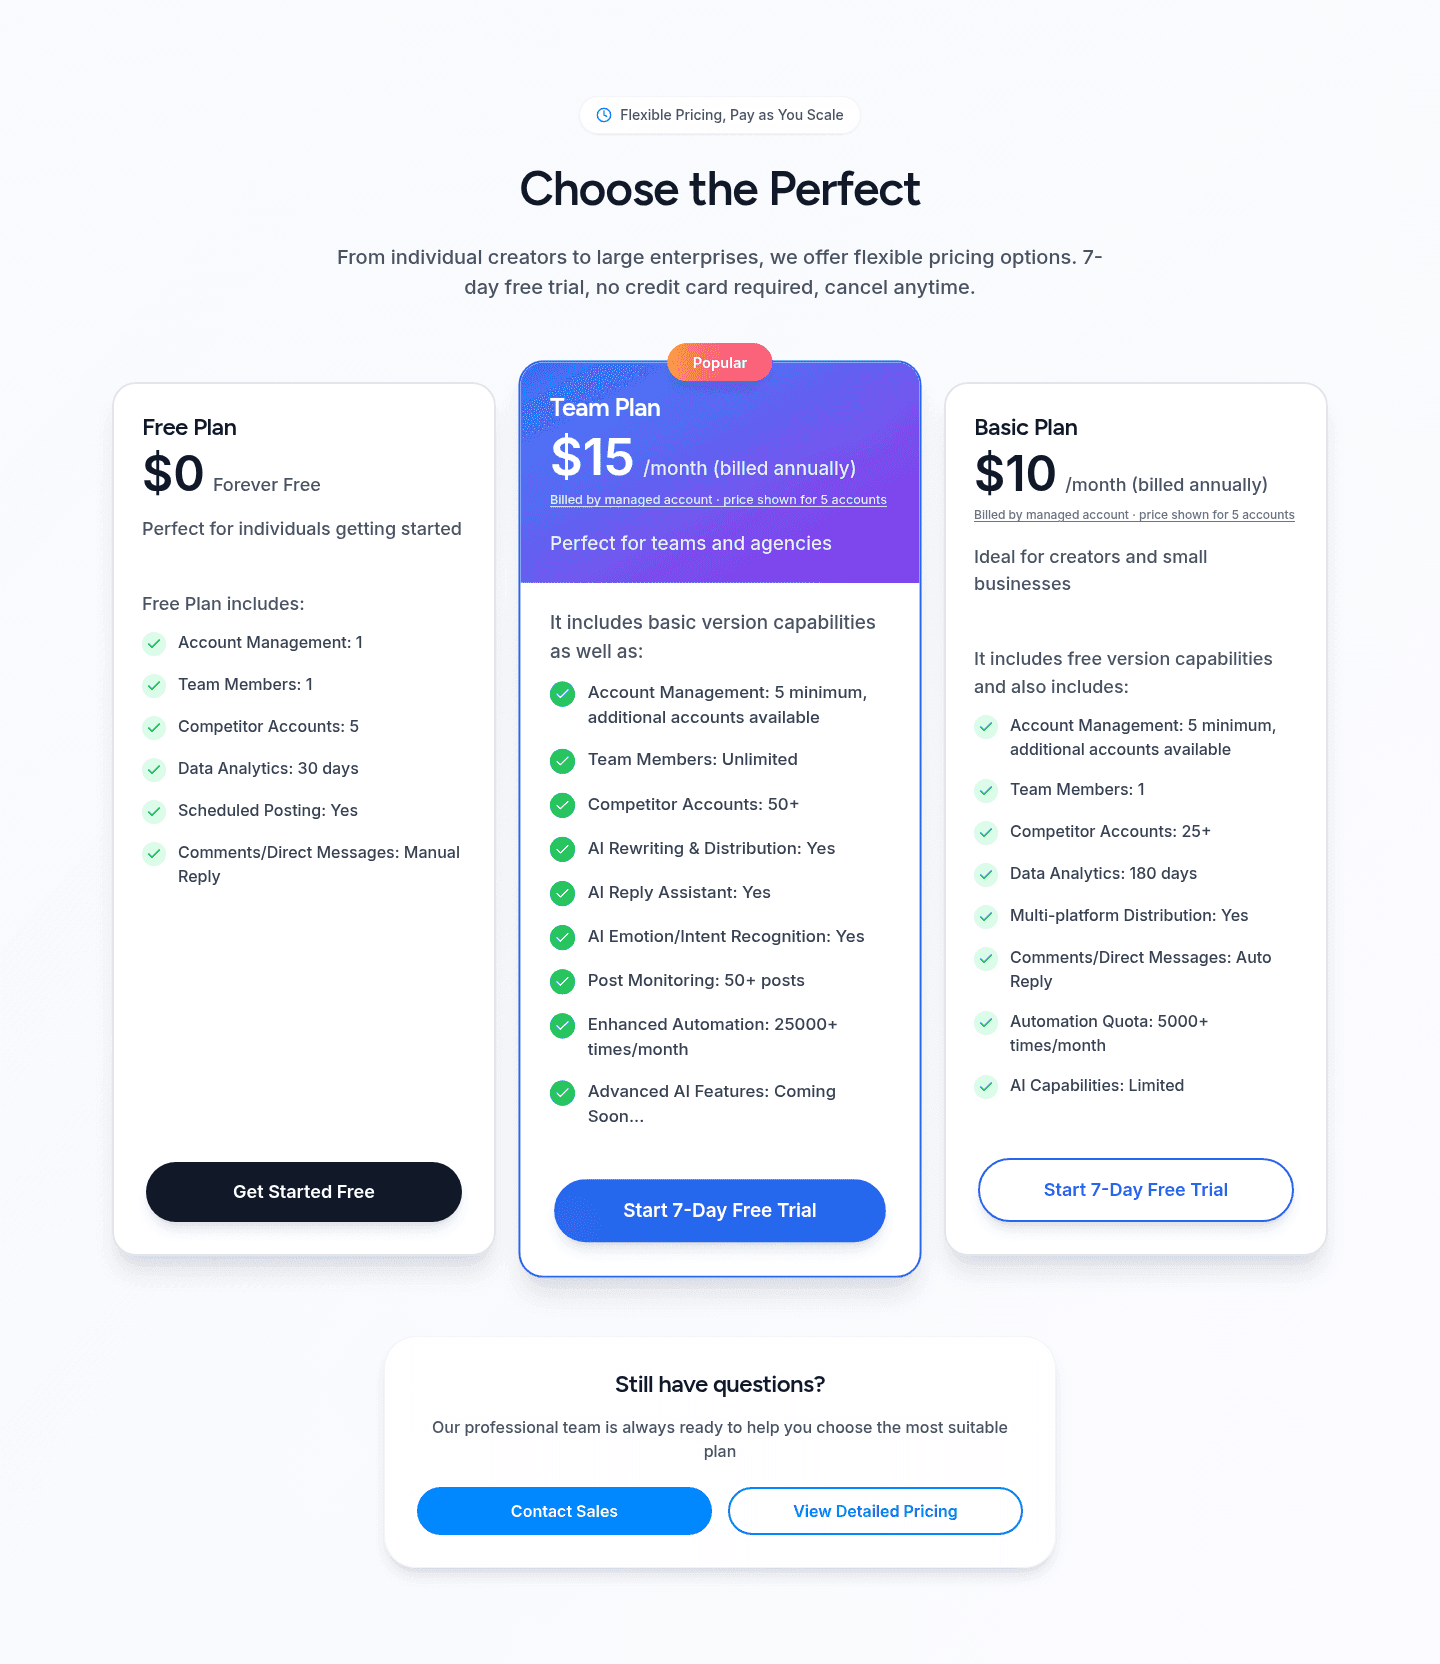
An easy-to-compare pricing table puts every plan side by side, so a visitor can read across the cards and see what changes from one tier to the next. The goal is not just to list prices. It is to make the differences between plans clear enough that a buyer picks the right one in seconds, instead of studying a wall of near-identical feature lists.
A few moves make plans easy to compare, and the strongest examples use several at once:
The pricing section is where a visitor stops reading and starts choosing. If the plans are hard to tell apart, the choice stalls: the buyer cannot see which tier is meant for them, so they hesitate or leave to think about it. A layout that pulls the differences to the surface does the comparing for them.
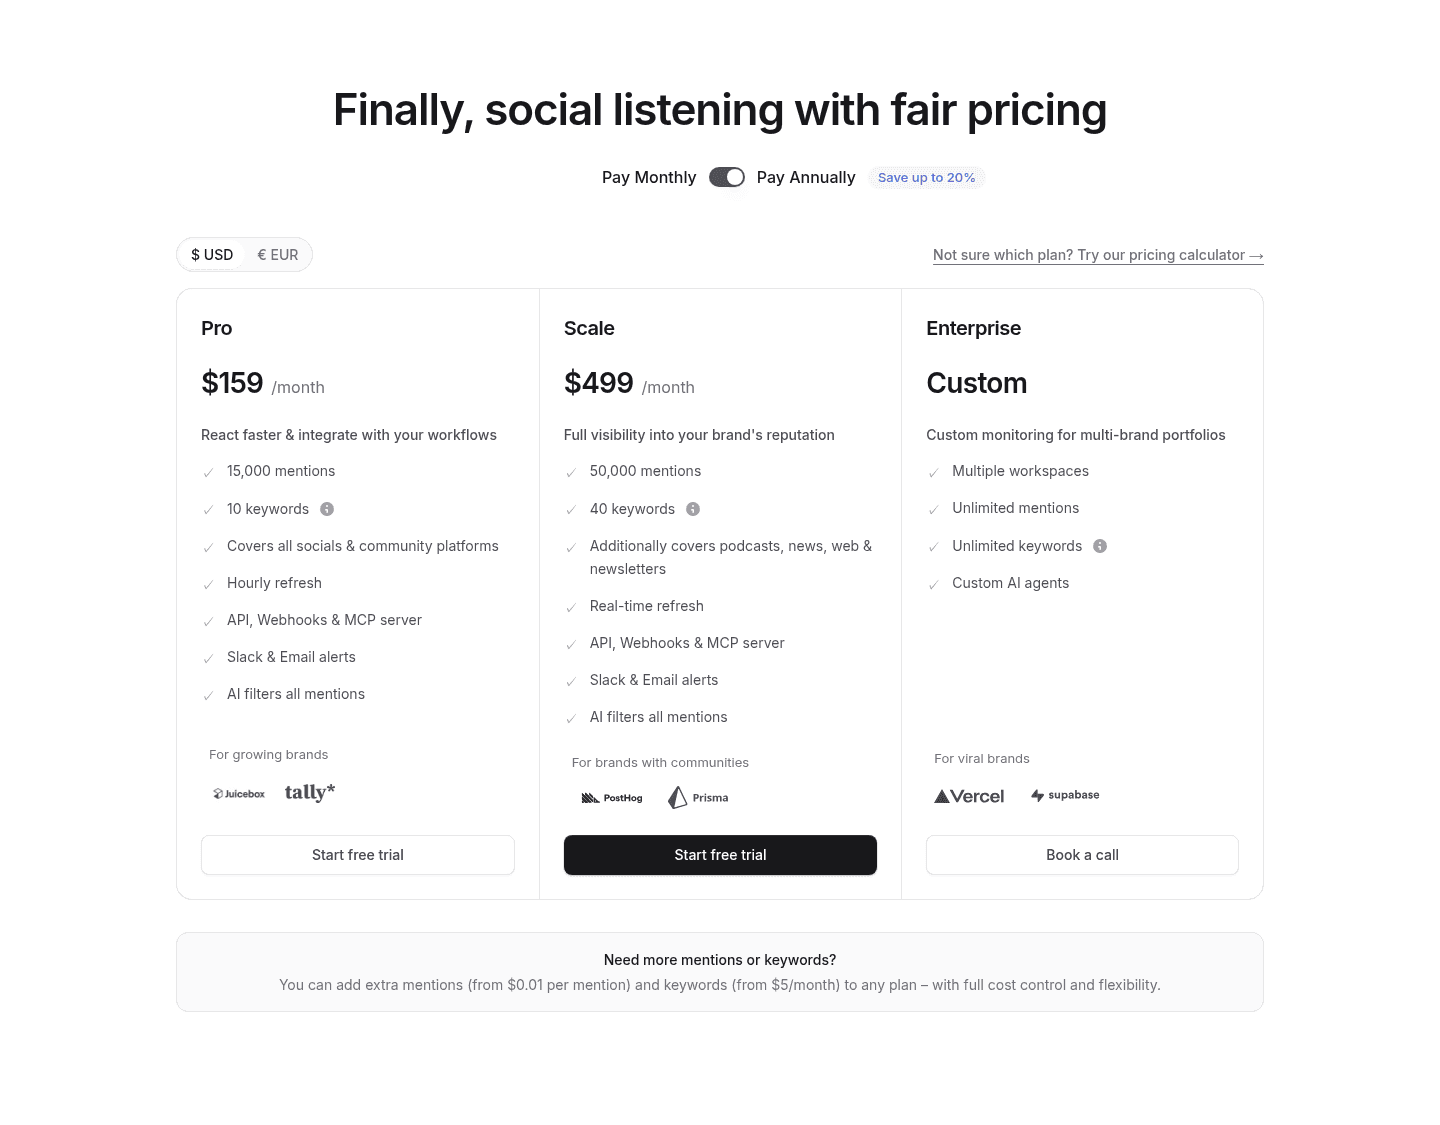
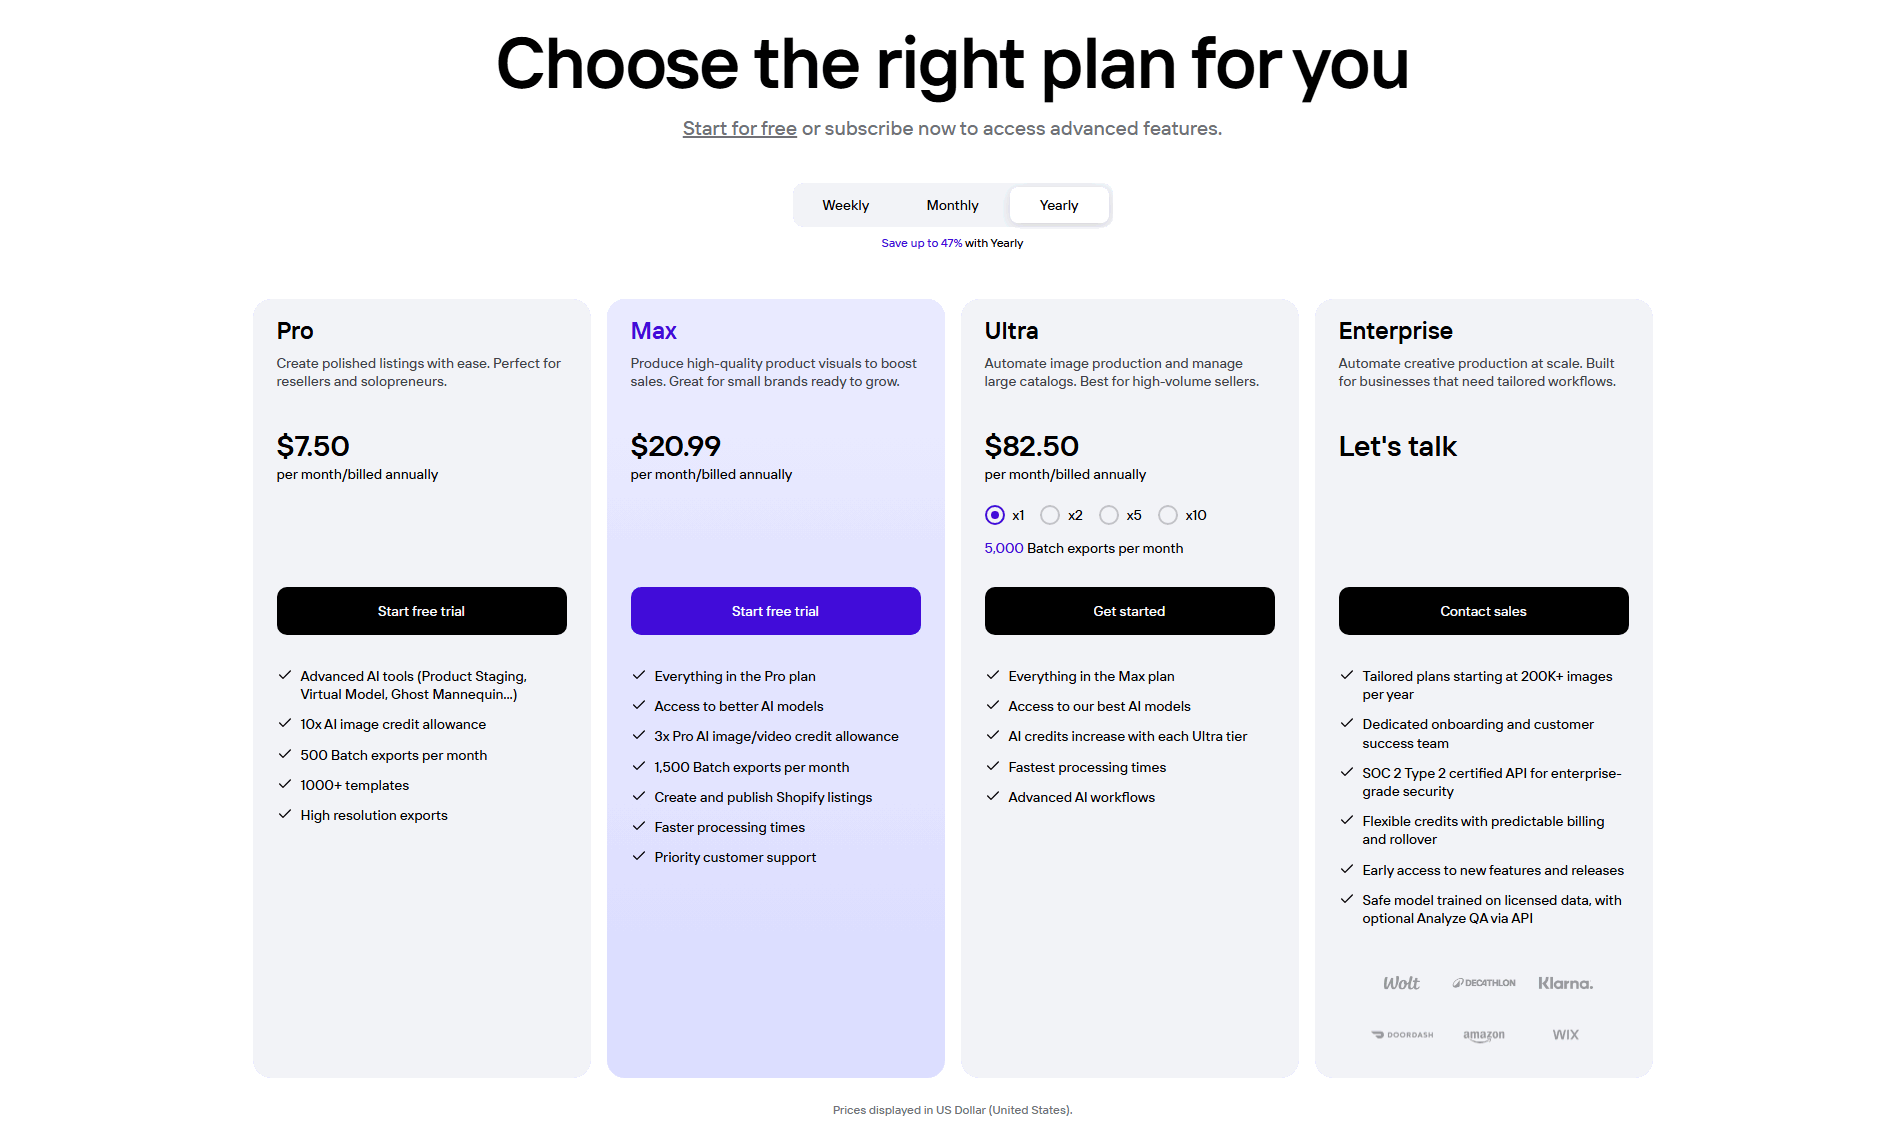
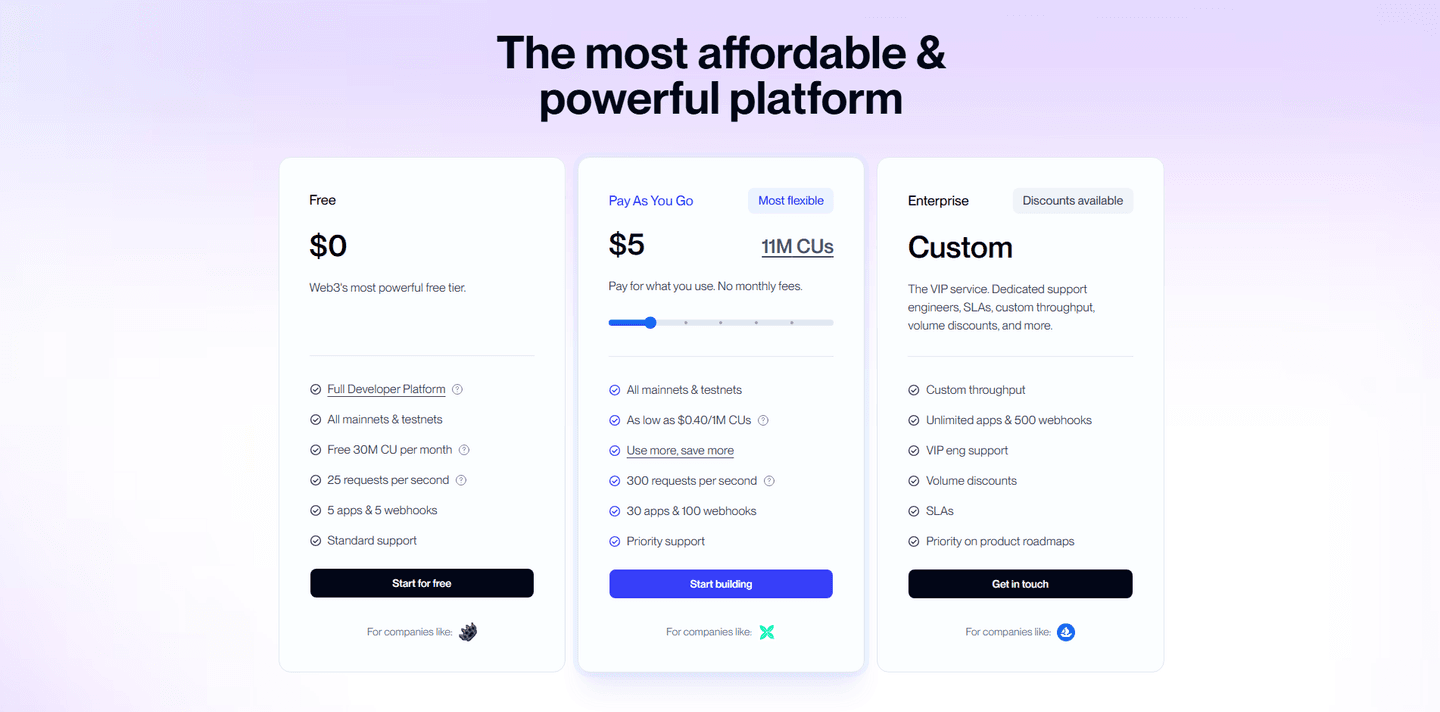
The best examples below cut down the number of things the eye has to track. Octolens keeps it to three tiers, each with a one-line description and a label like "For growing brands", so the choice reads as Pro, Scale or Enterprise before any feature comes into it. PhotoRoom and PandaDoc stack each plan as "Everything in the previous plan, plus", which turns the upgrade path into a short list of additions instead of four full lists the buyer has to compare line by line. And where usage changes the price, the clearest sections do the math on the card, the way Alchemy's usage slider and CompanyCam's team-size stepper update the plan in front of the buyer.
Easy comparison rarely works alone. It reads best next to value-based plan names that show a progression rather than generic tier numbers, and a recommended-plan badge that anchors attention on the tier most buyers should pick.
100/100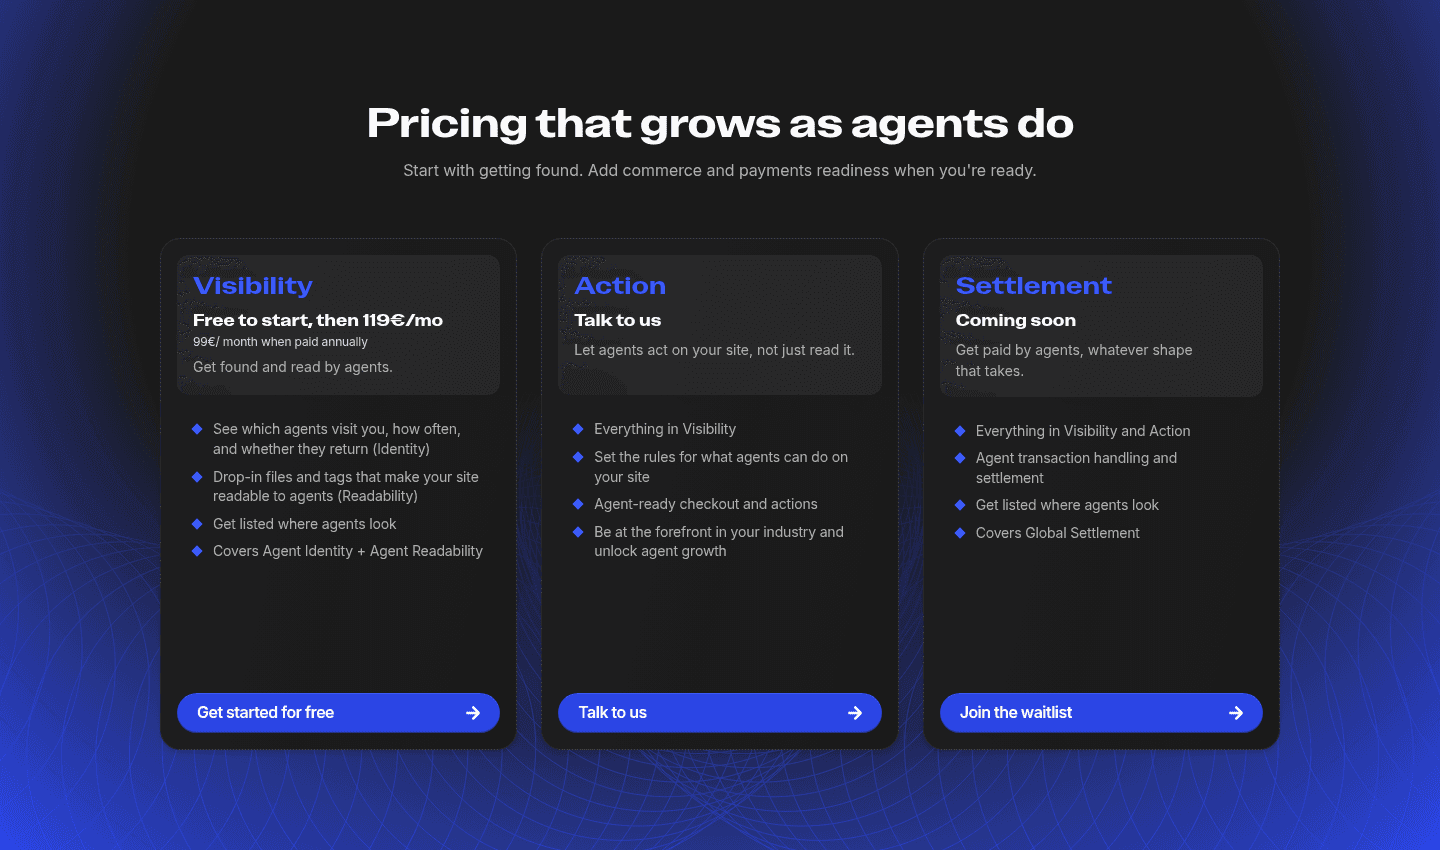
The usual failure is cards that cannot be weighed against each other. In the example above, only one of three plans shows a price; the others say "Talk to us" and "Coming soon", and the feature lists do not line up, so there is nothing to compare. The second failure is cards that all look the same: four long feature lists in one order and no cue for which to choose. The third is misaligned rows, where a feature sits third on one card and seventh on the next, so reading across becomes a hunt.

Curated by
Gabriel Amzallag , Founder, Web Anatomy
5 years CRO + SEO at Qonto (2021–2025). After advising 15+ SaaS on their websites (Payfit, Pigment…), the same patterns kept breaking, so I decided to build the source of truth on what works on the web: the intelligence layer every tool, builder, and team uses to ship sites that perform.
The common questions about making pricing plans easy to compare, with answers drawn from 100 scored examples.
Three or four is common among the examples below. Octolens, Raycast and Sleek Analytics use three; PhotoRoom, PandaDoc and CompanyCam use four. Past that, the plans no longer fit in one view, so sections with five or six tiers lean harder on a highlighted plan and clear names. What matters most is whether a buyer can tell the tiers apart at a glance.
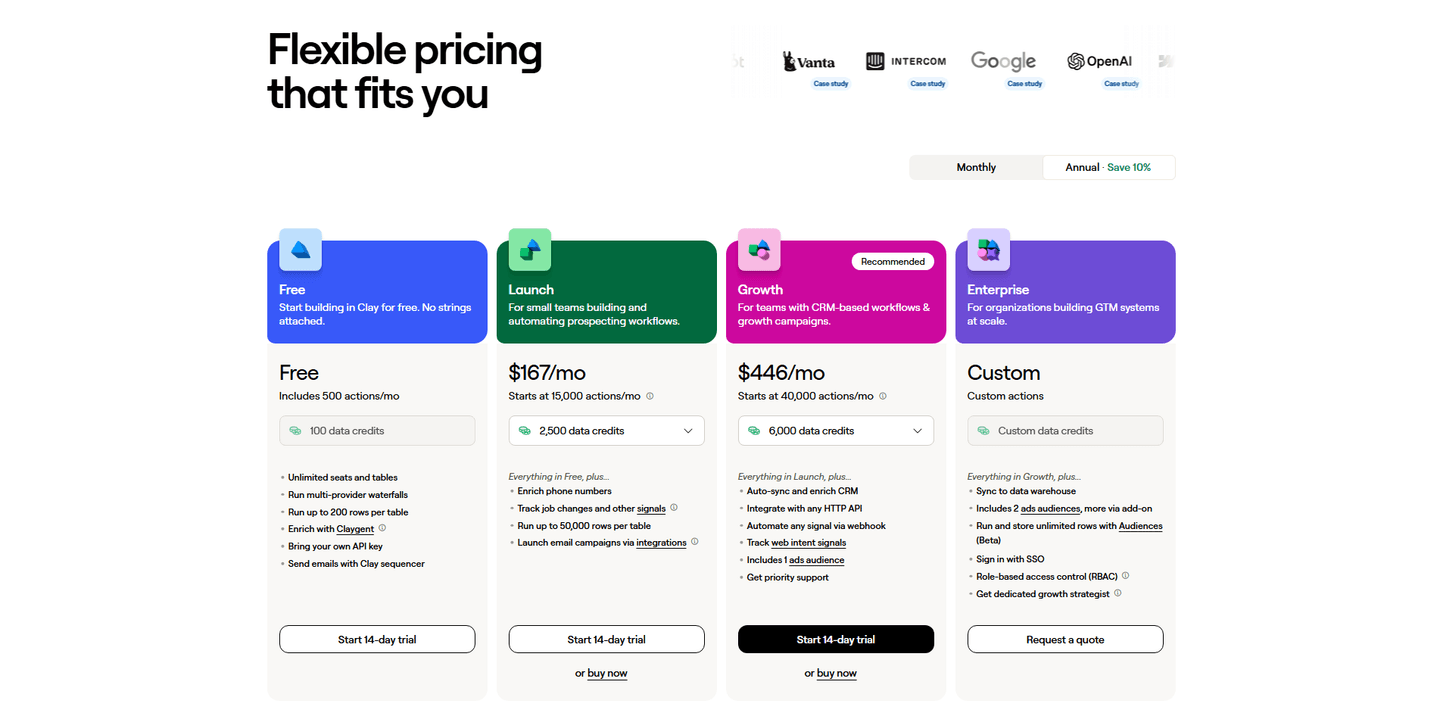
Usually, yes. A highlighted plan gives the undecided buyer a default. Raycast lifts its center Pro card, Clay puts a Recommended badge on Growth, PandaDoc runs a MOST POPULAR ribbon on Business, and Alchemy flags its middle card Most flexible. The badge answers the question many buyers arrive with: which one should I pick?