Pricing Table|
A pricing table that highlights the differences between plans lets a visitor see what each tier unlocks in one glance, instead of reading every row to work it out.
Key takeaways
Showing 1–29 of 34 examples
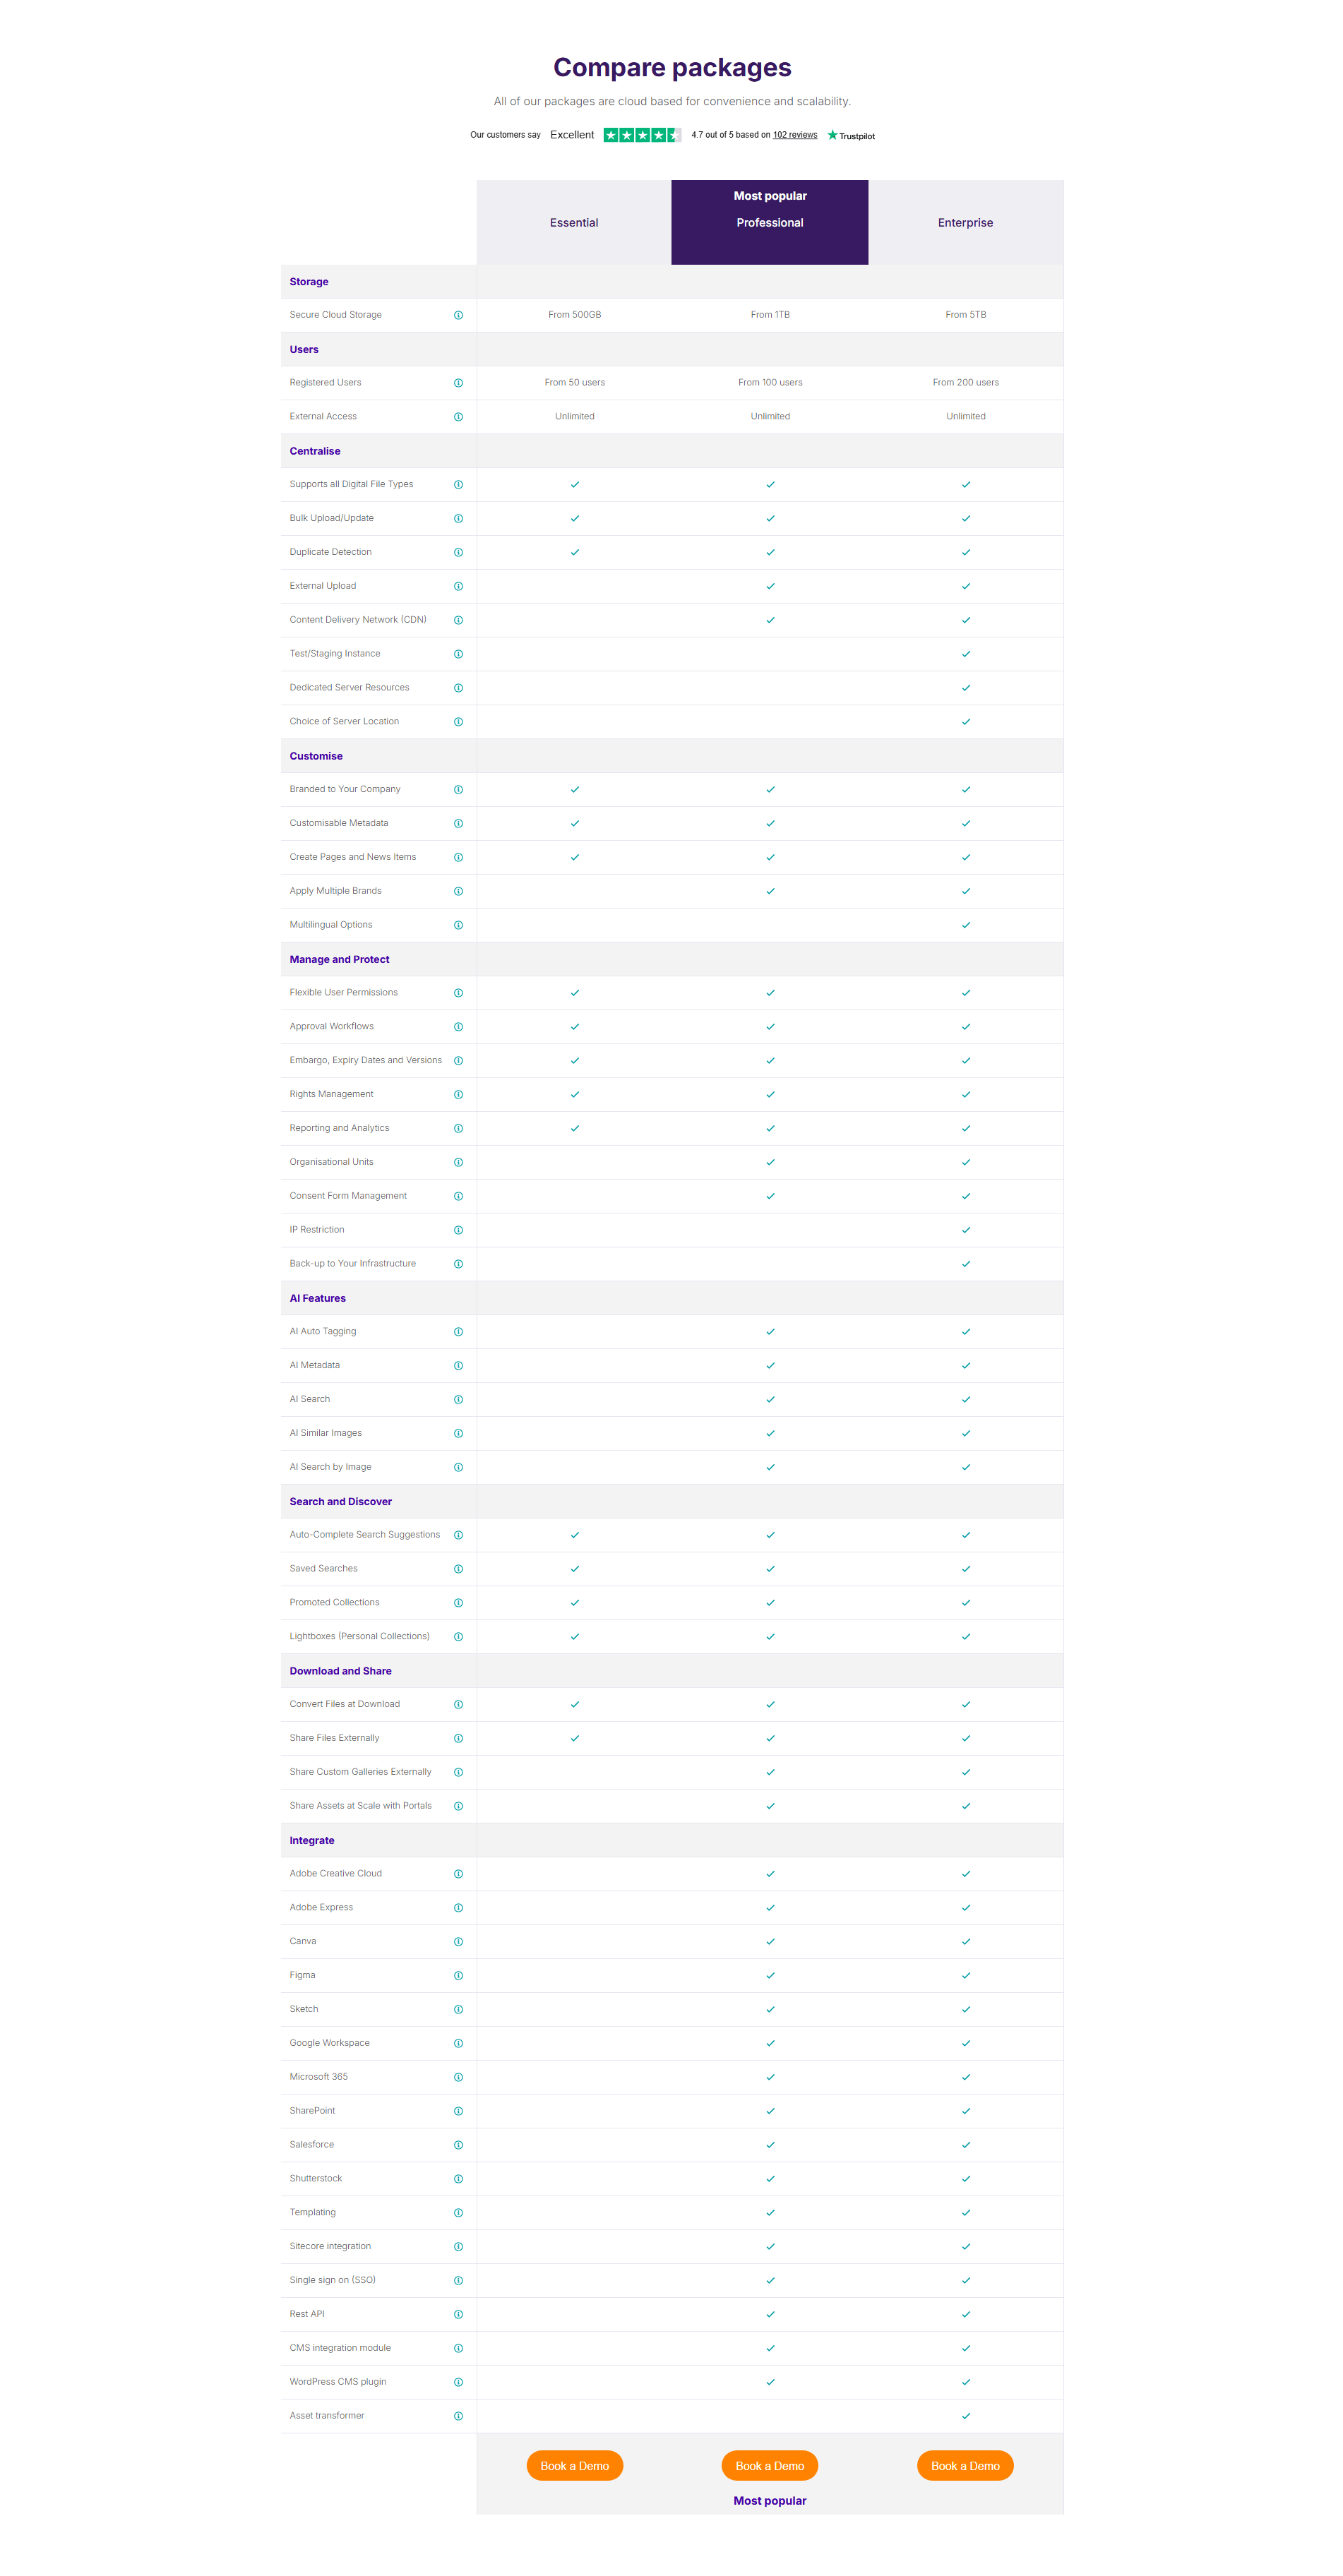
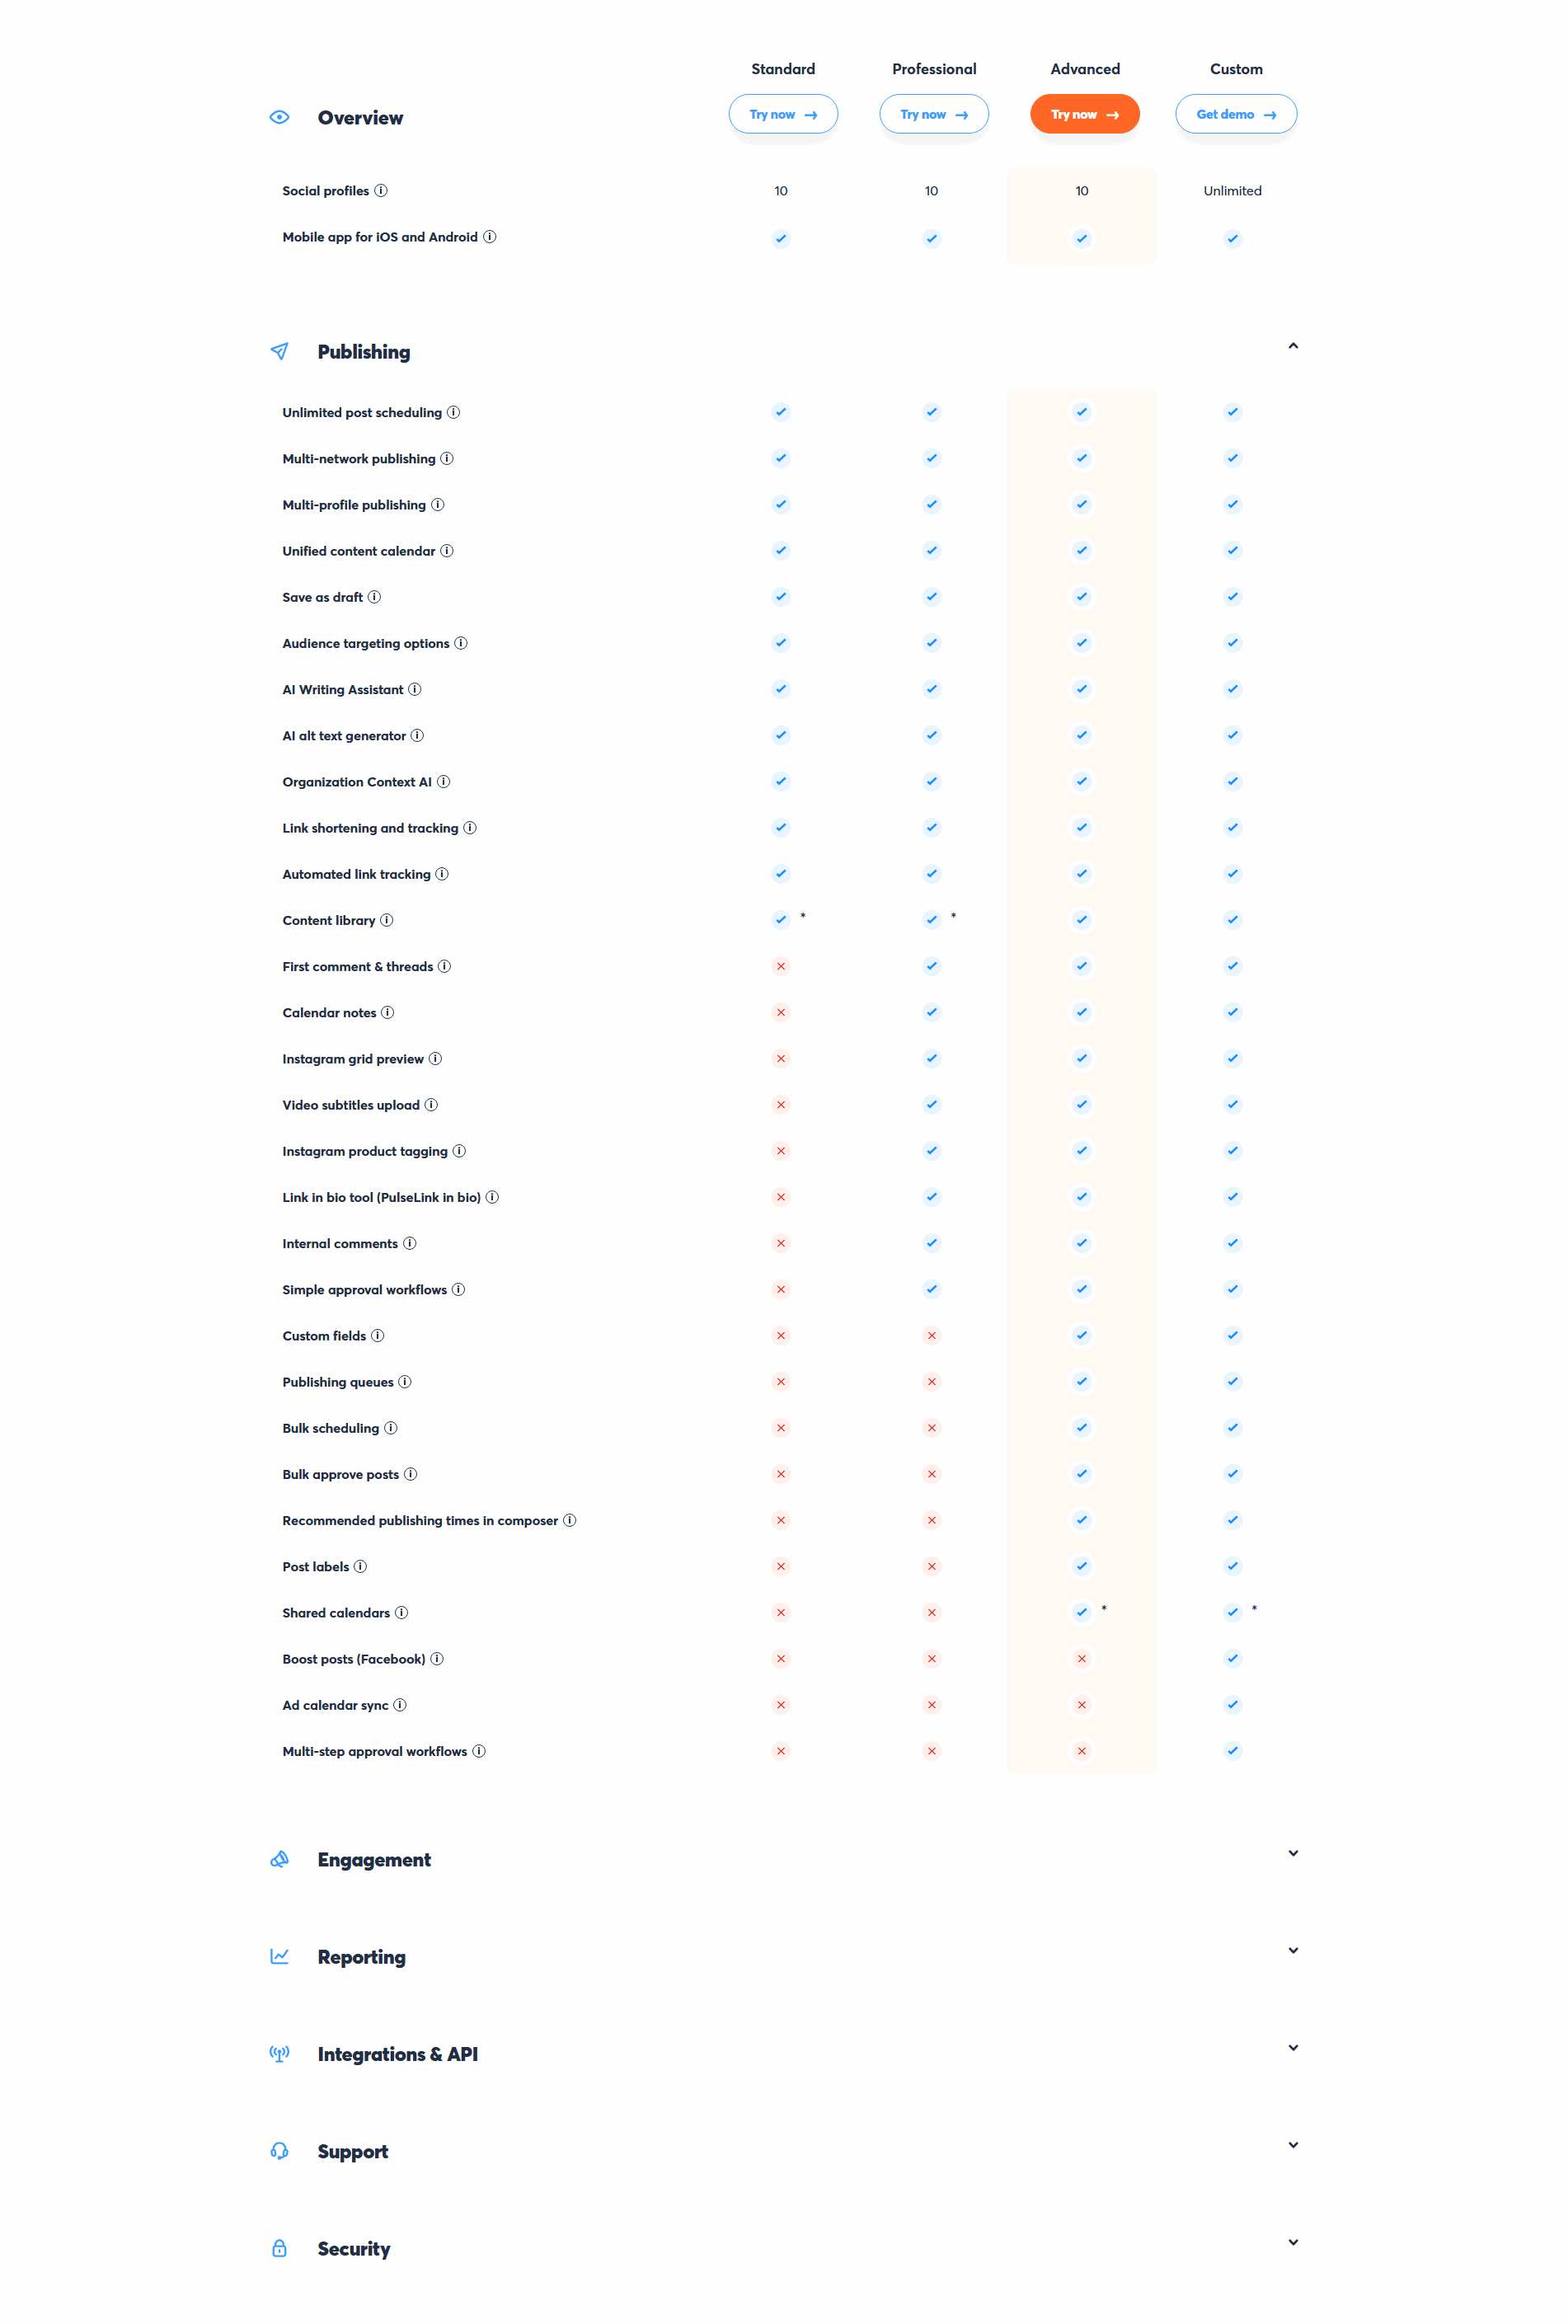
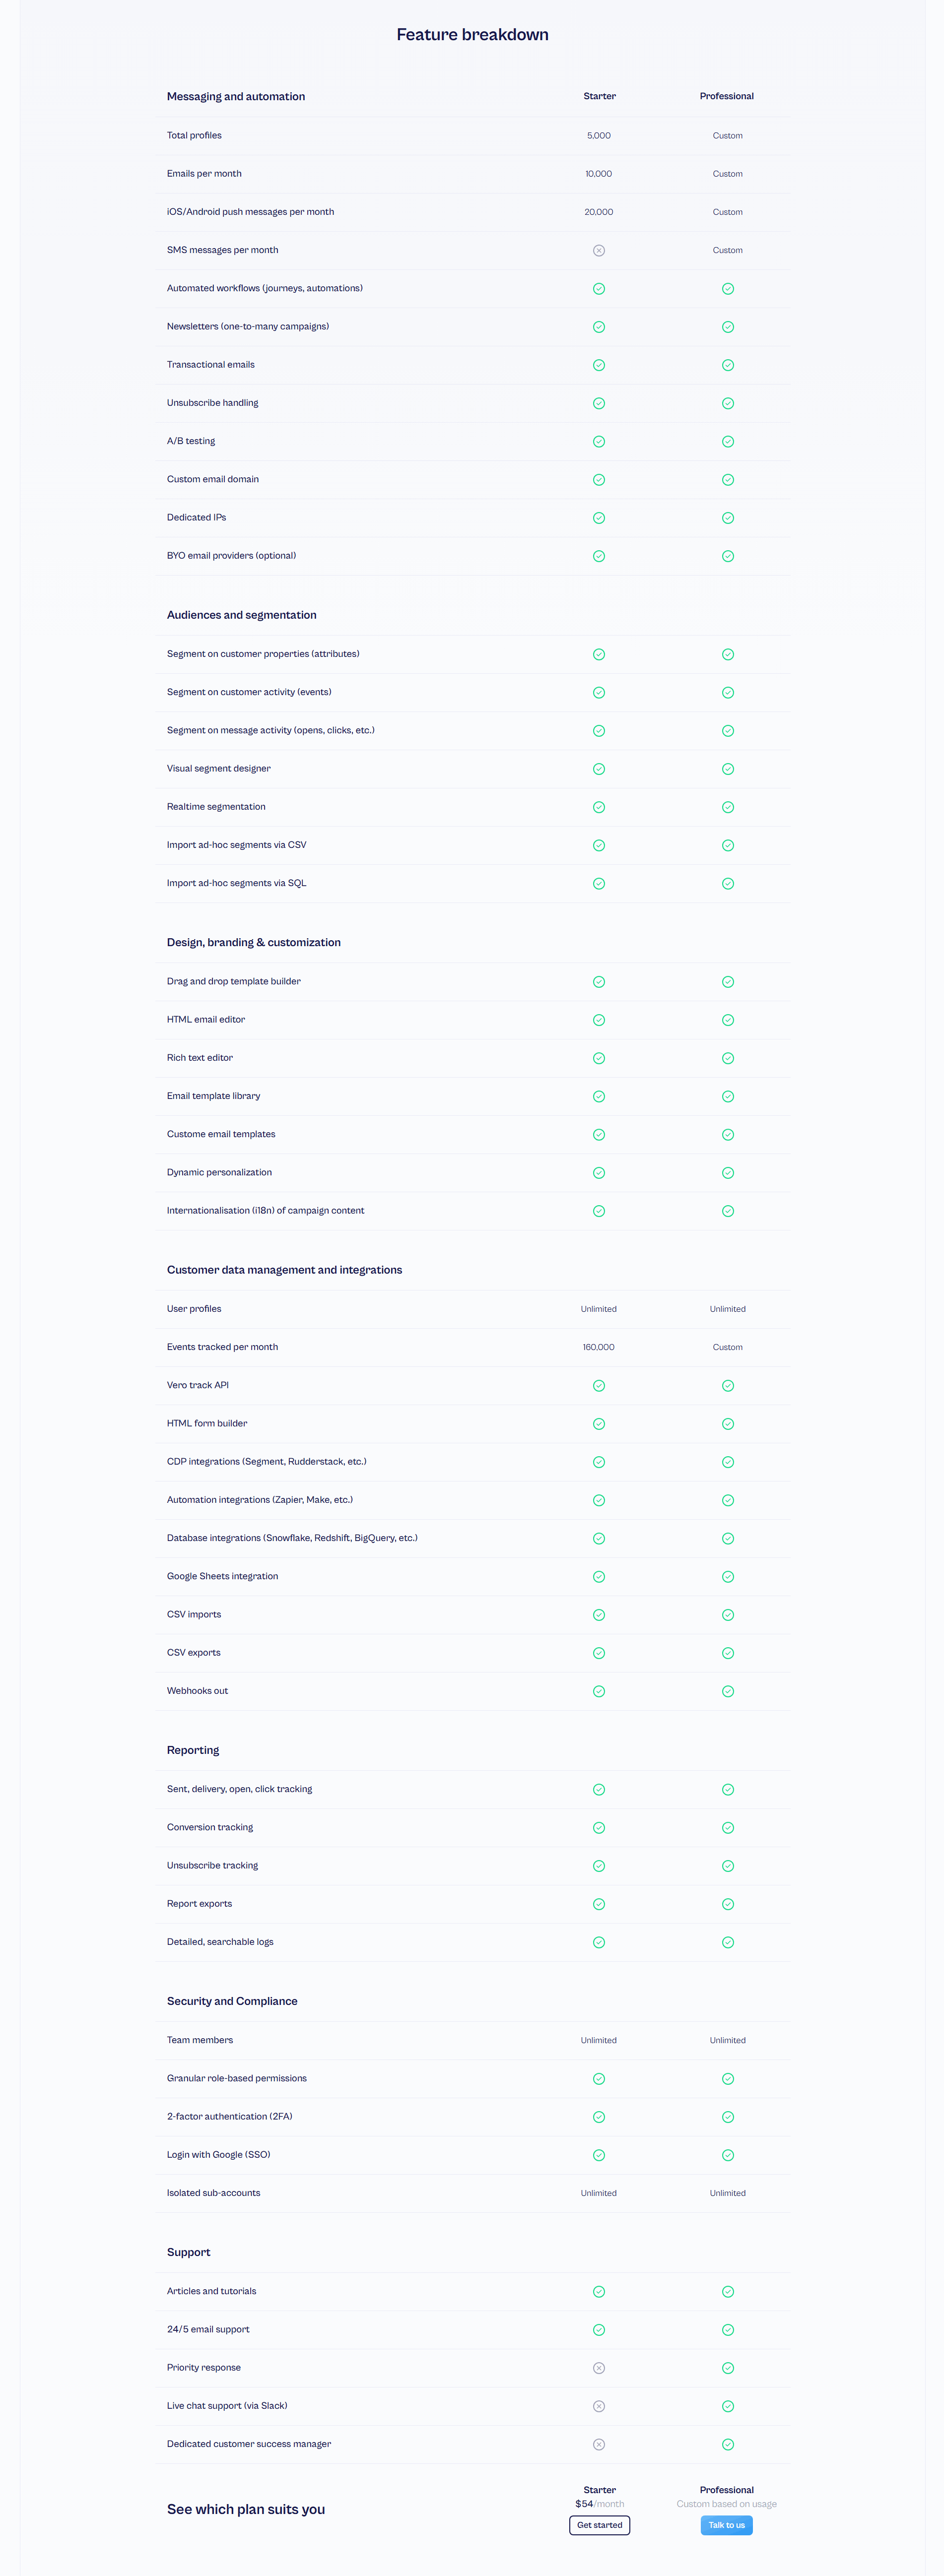
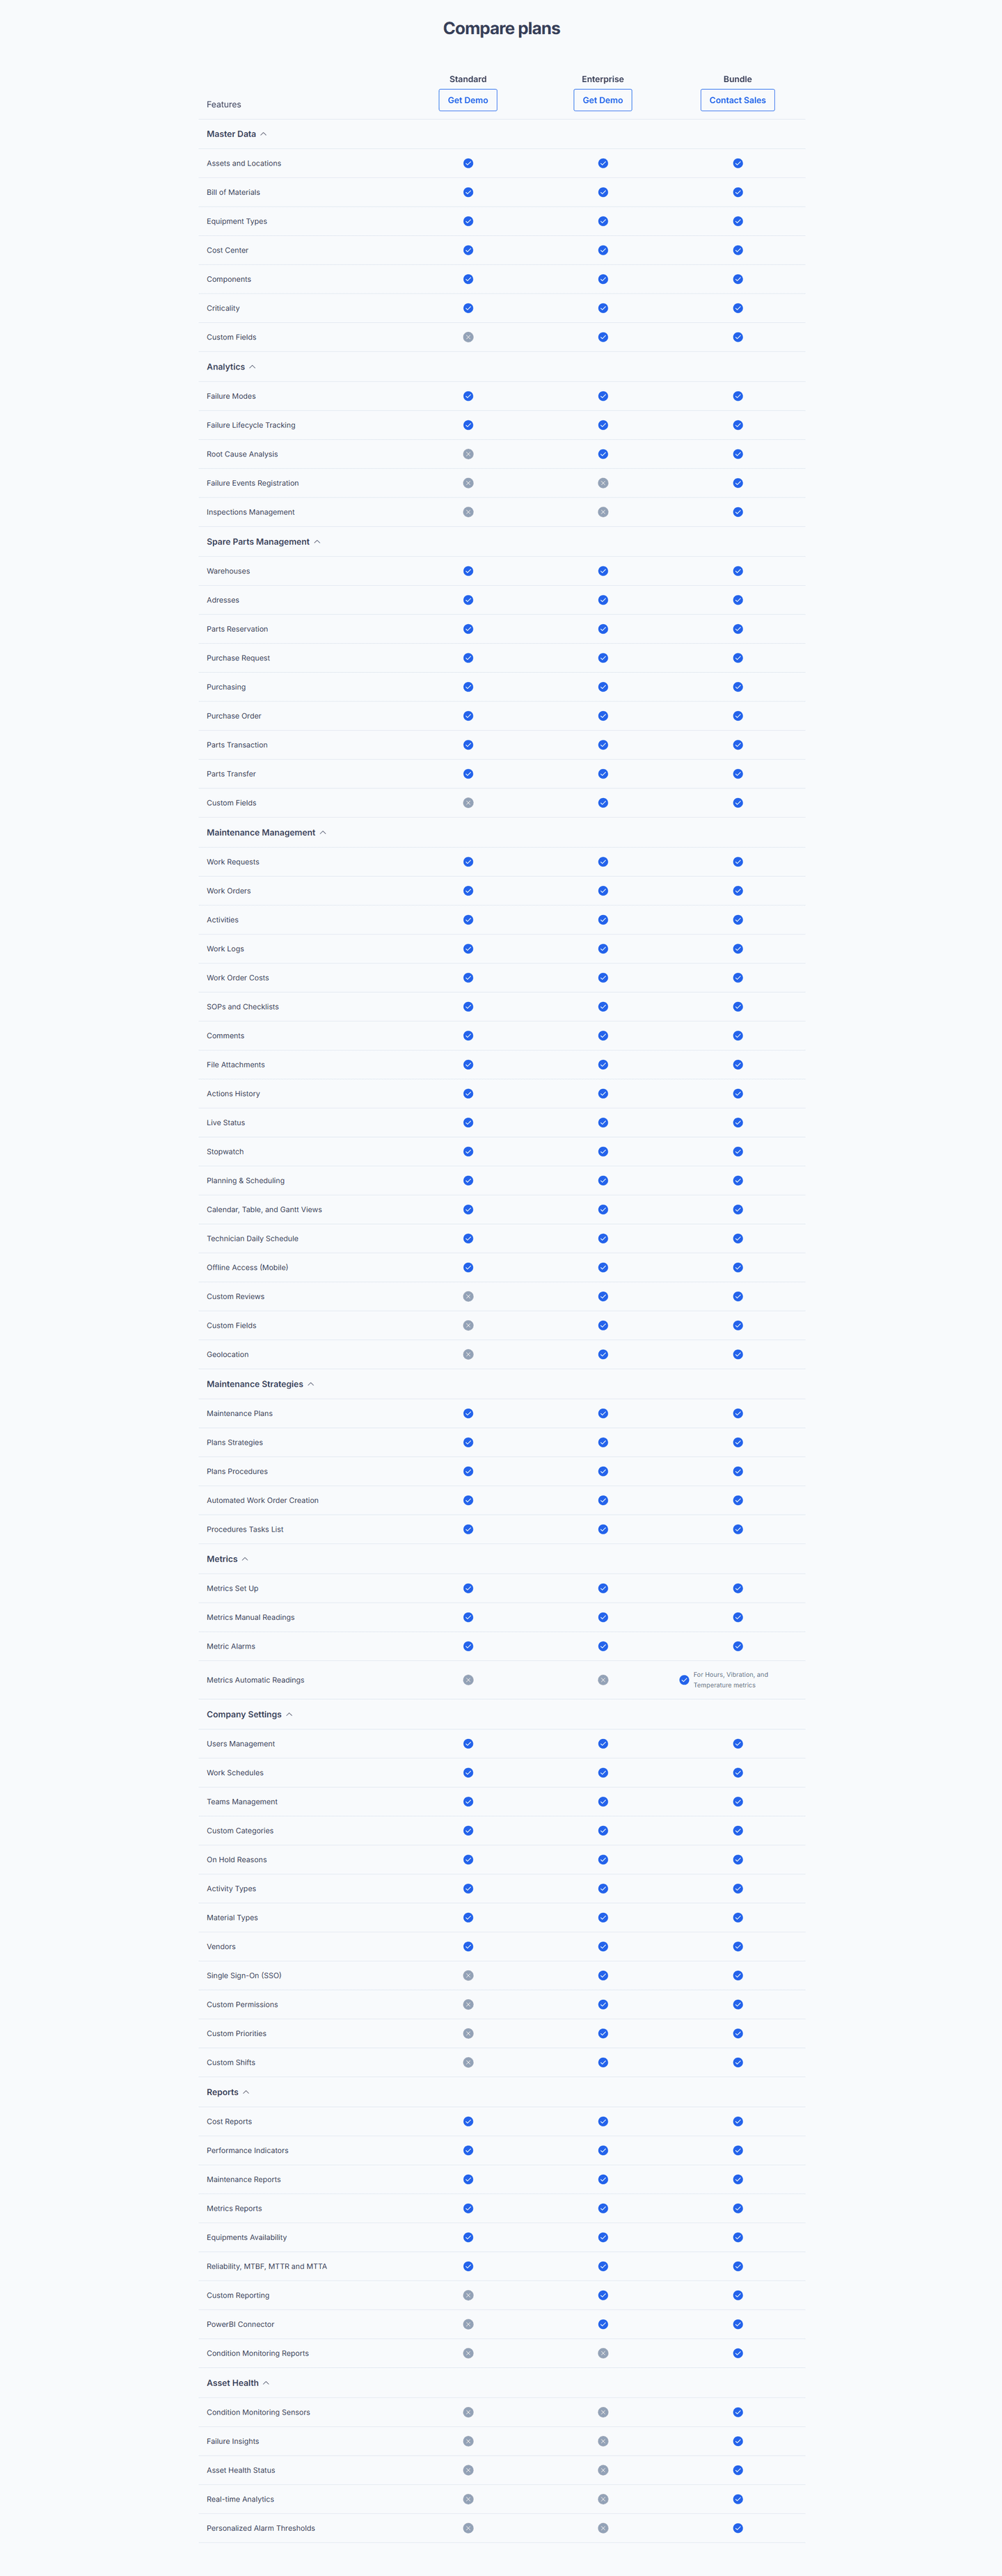
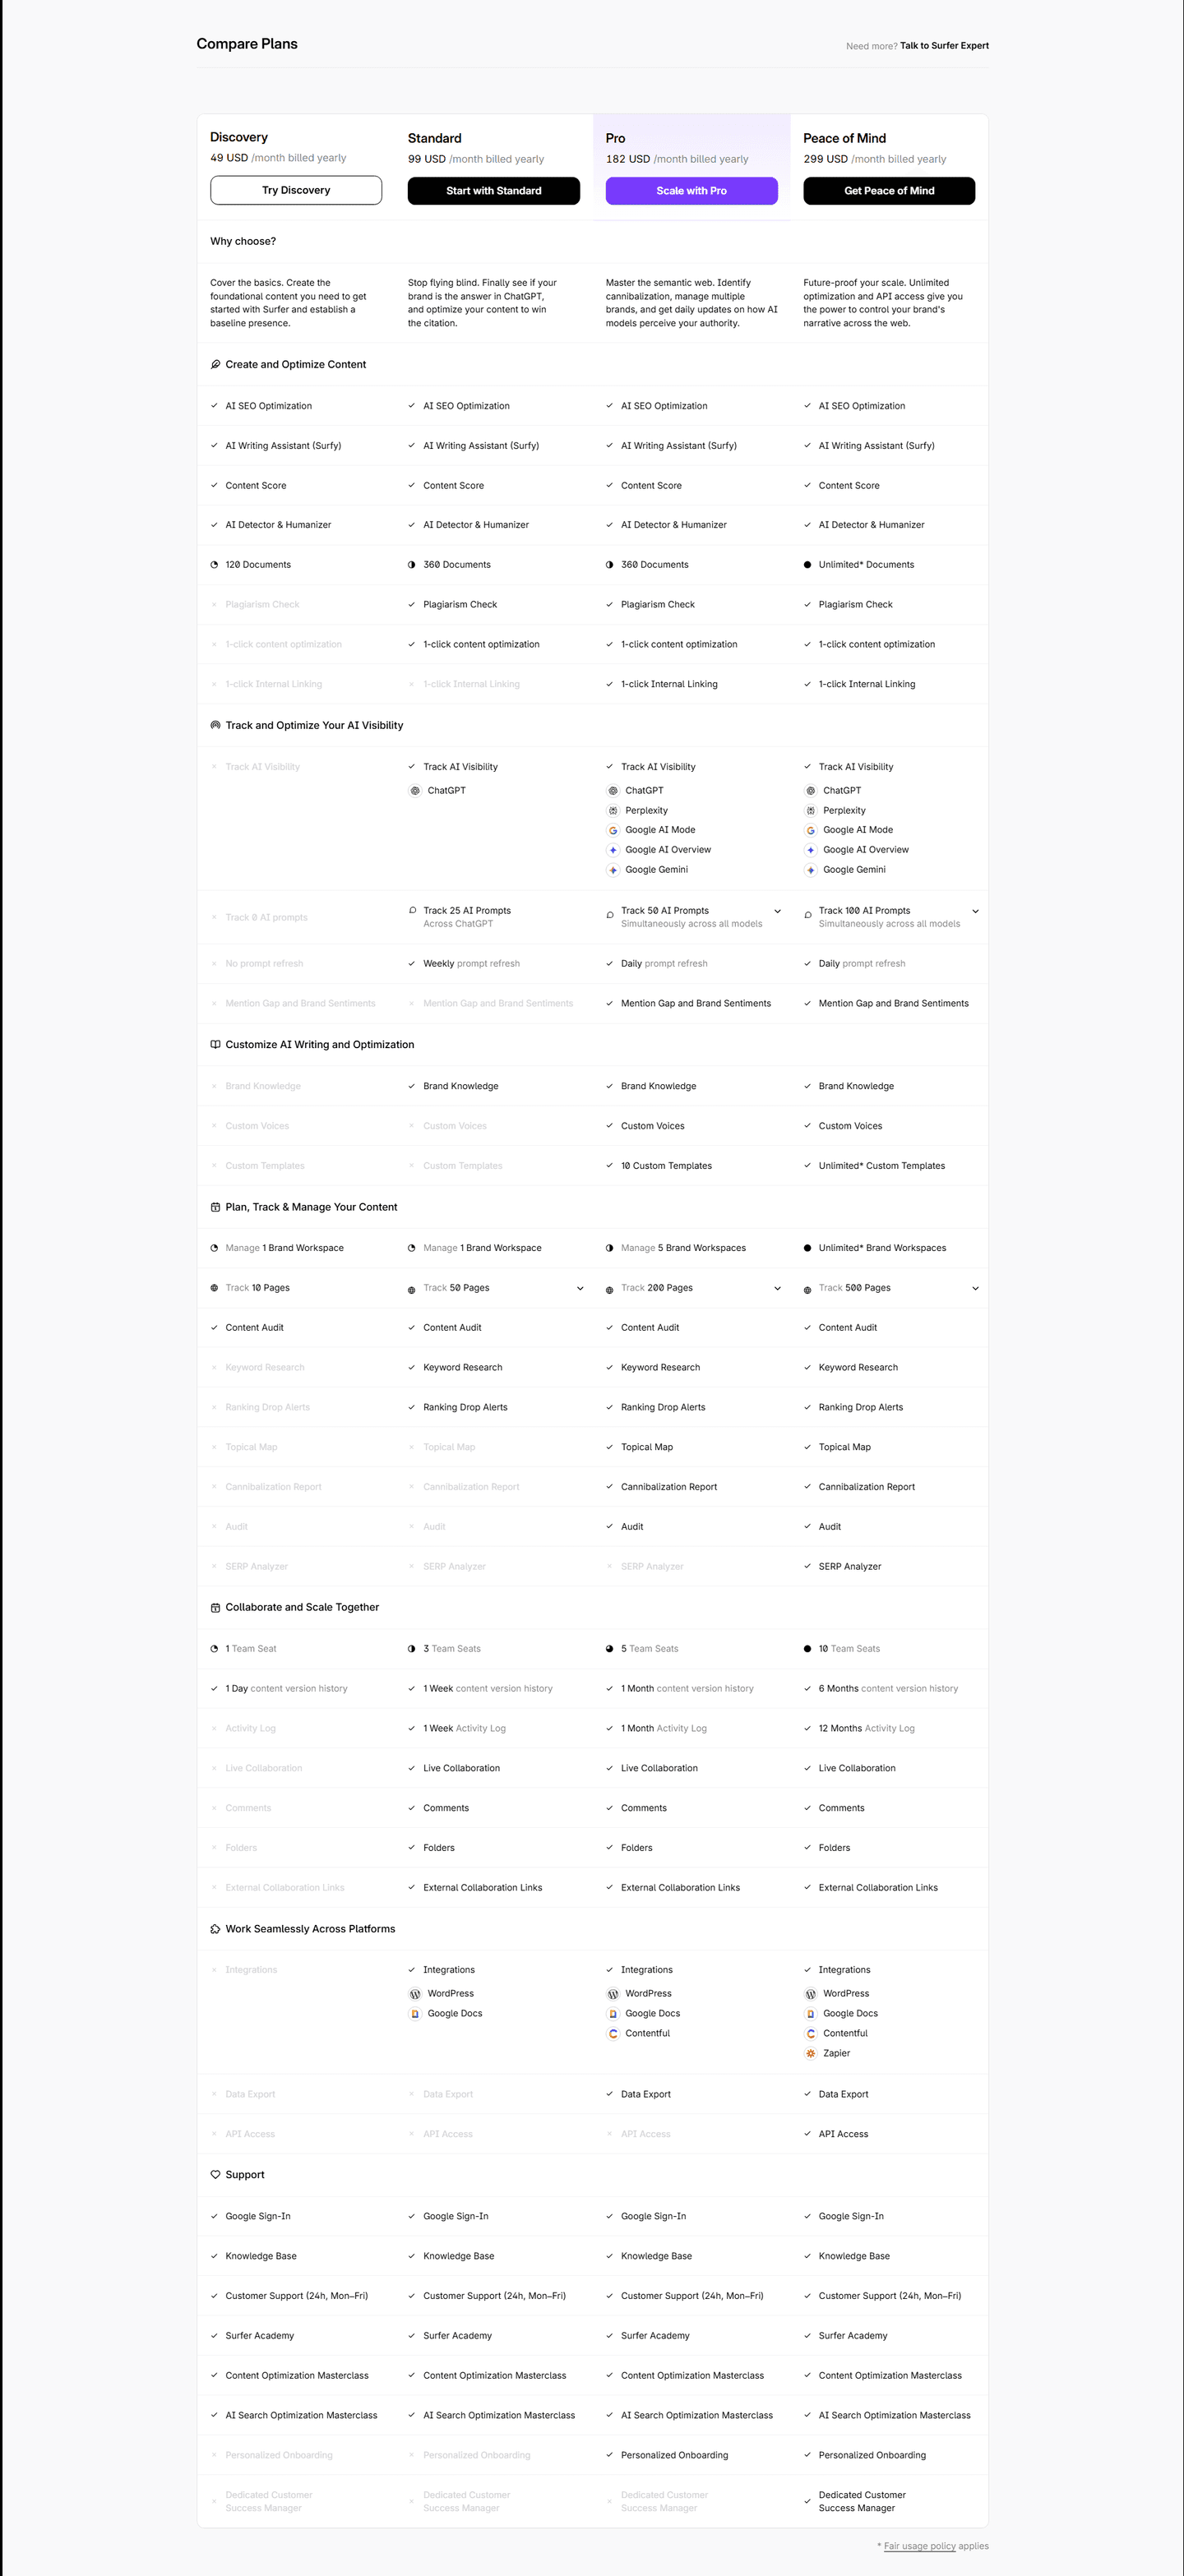
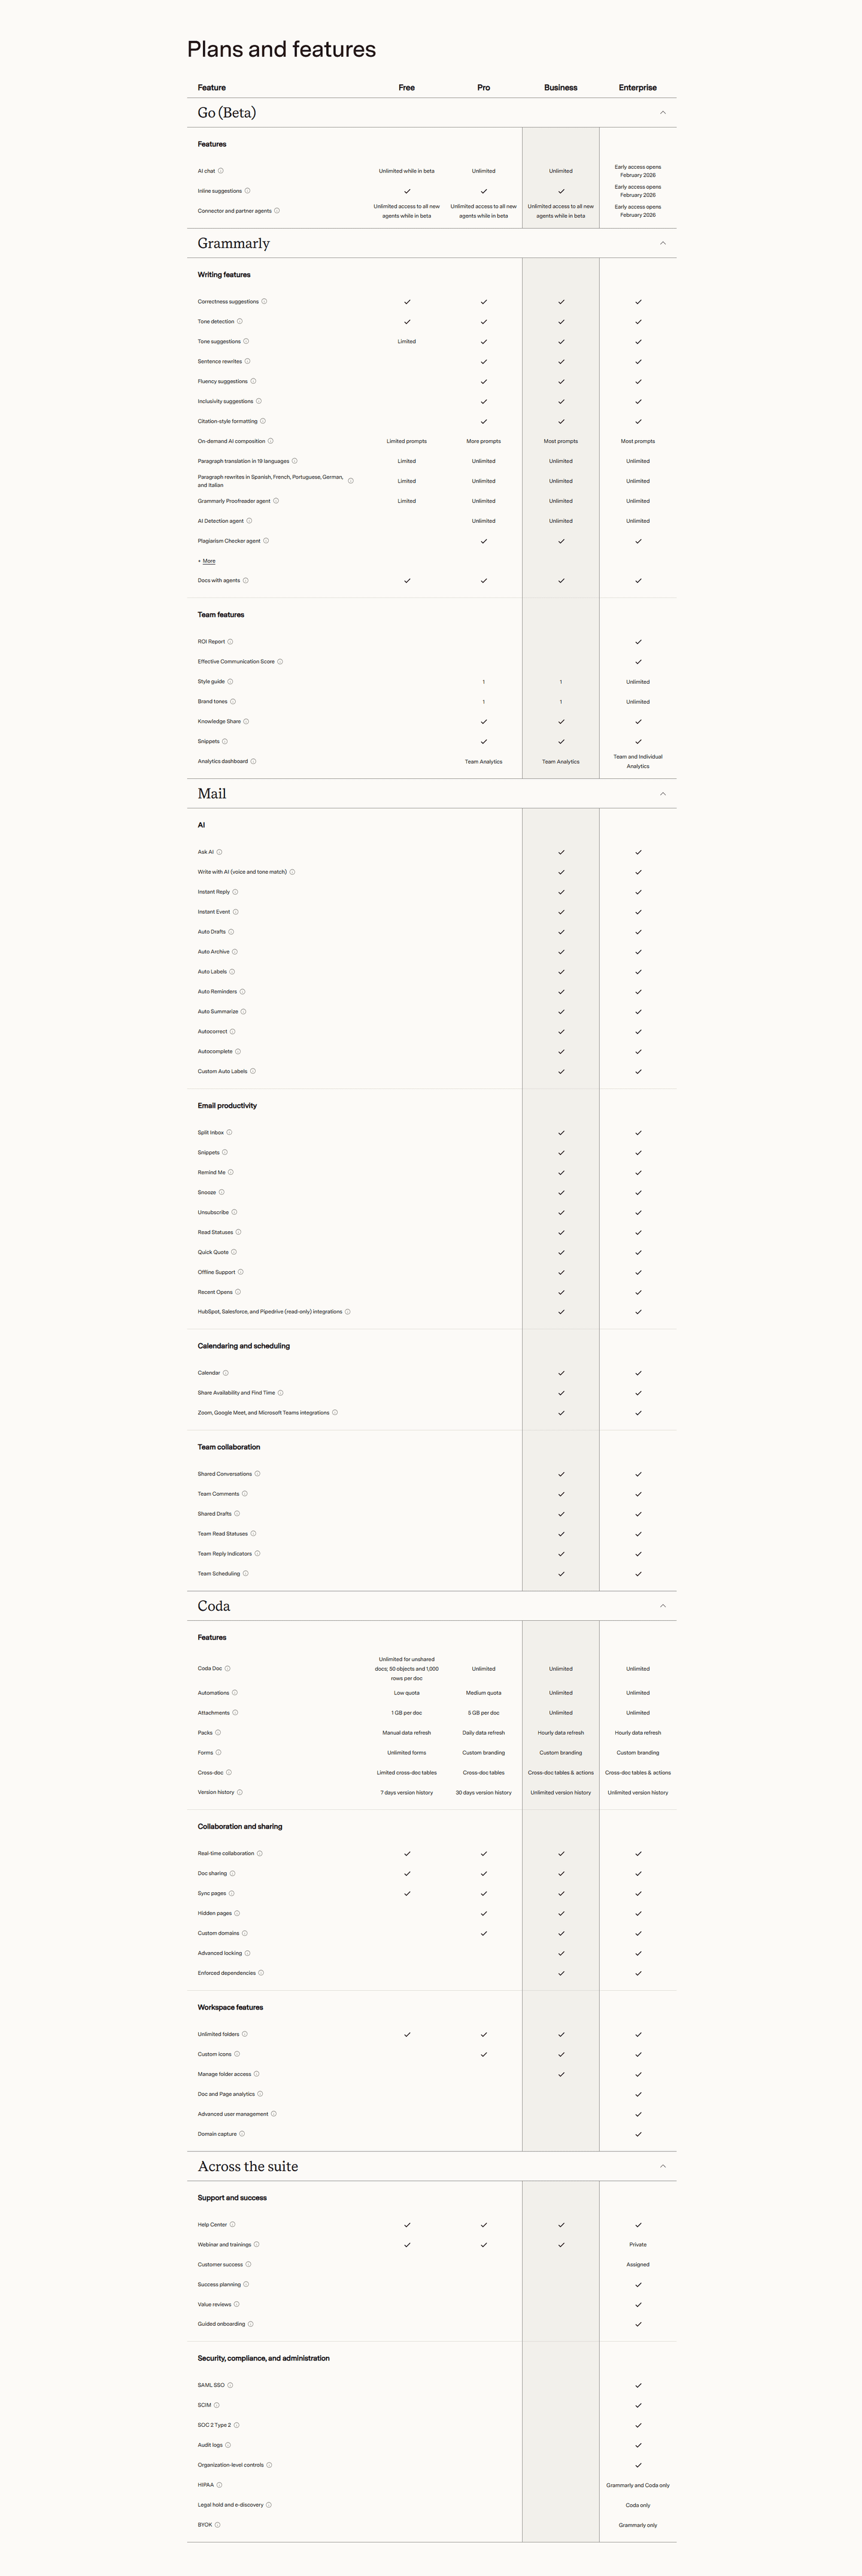
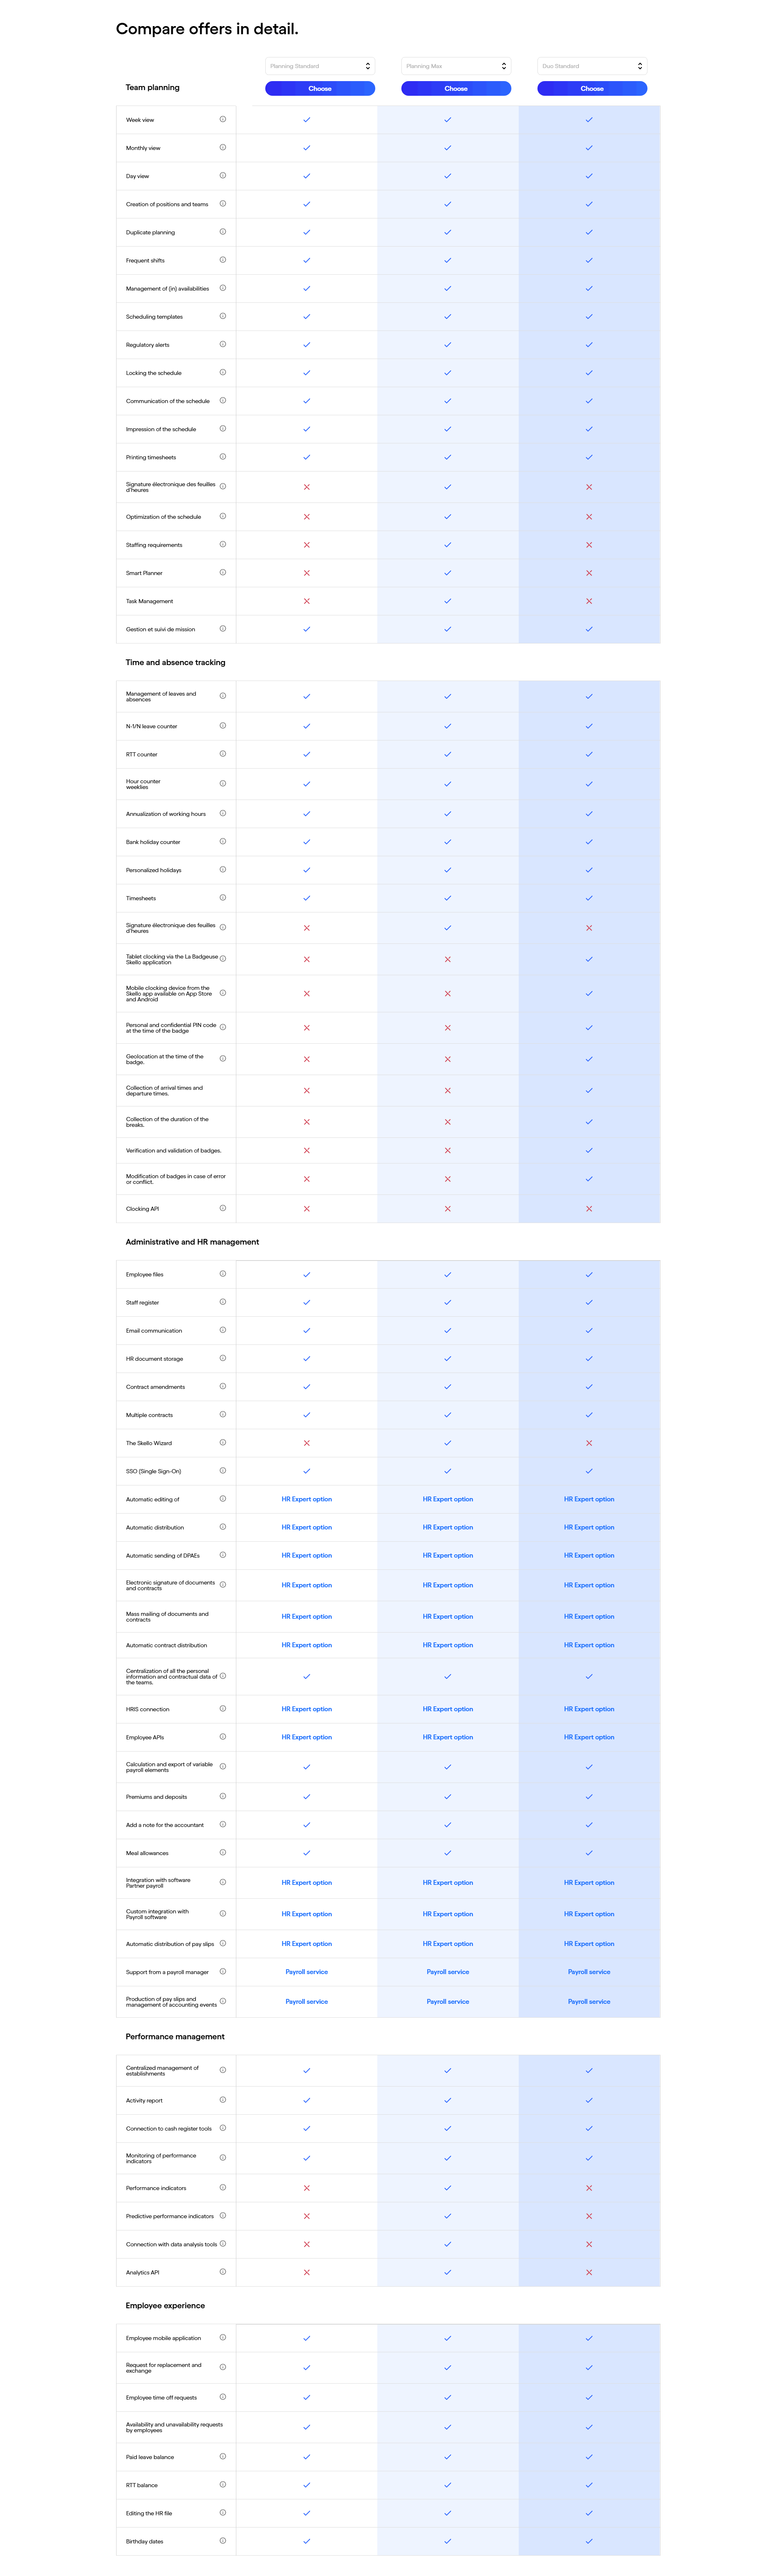
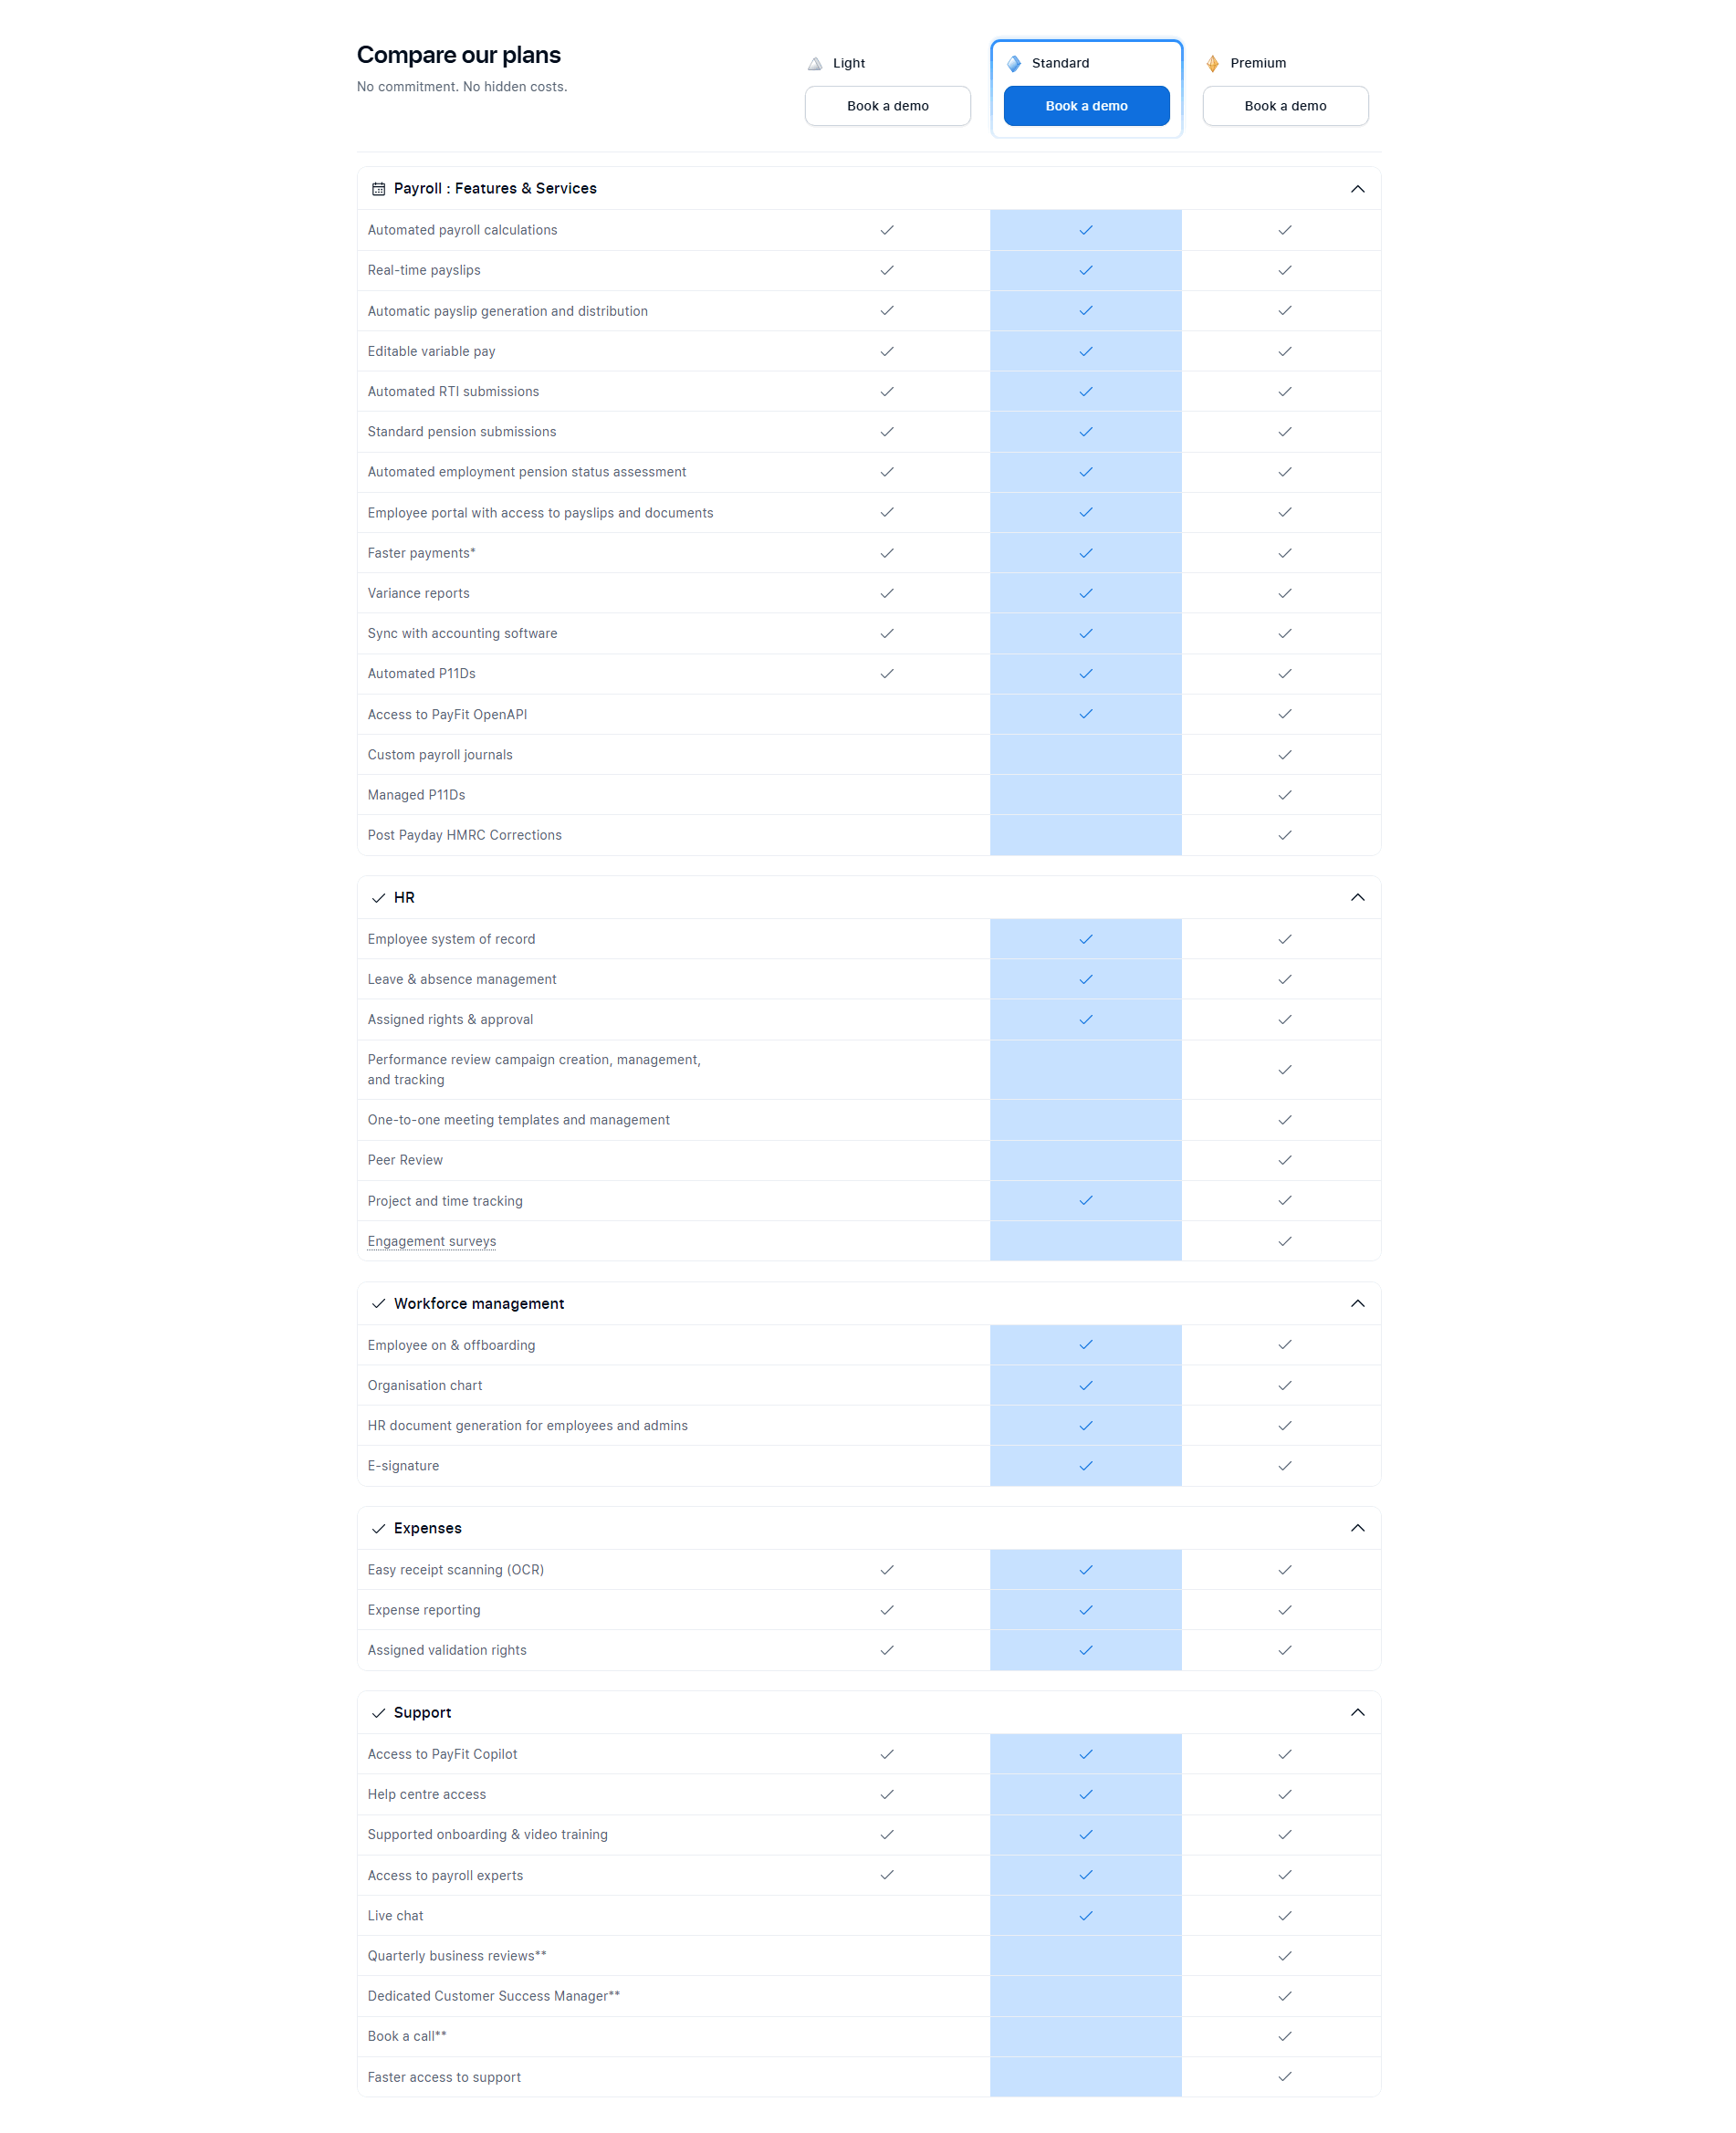
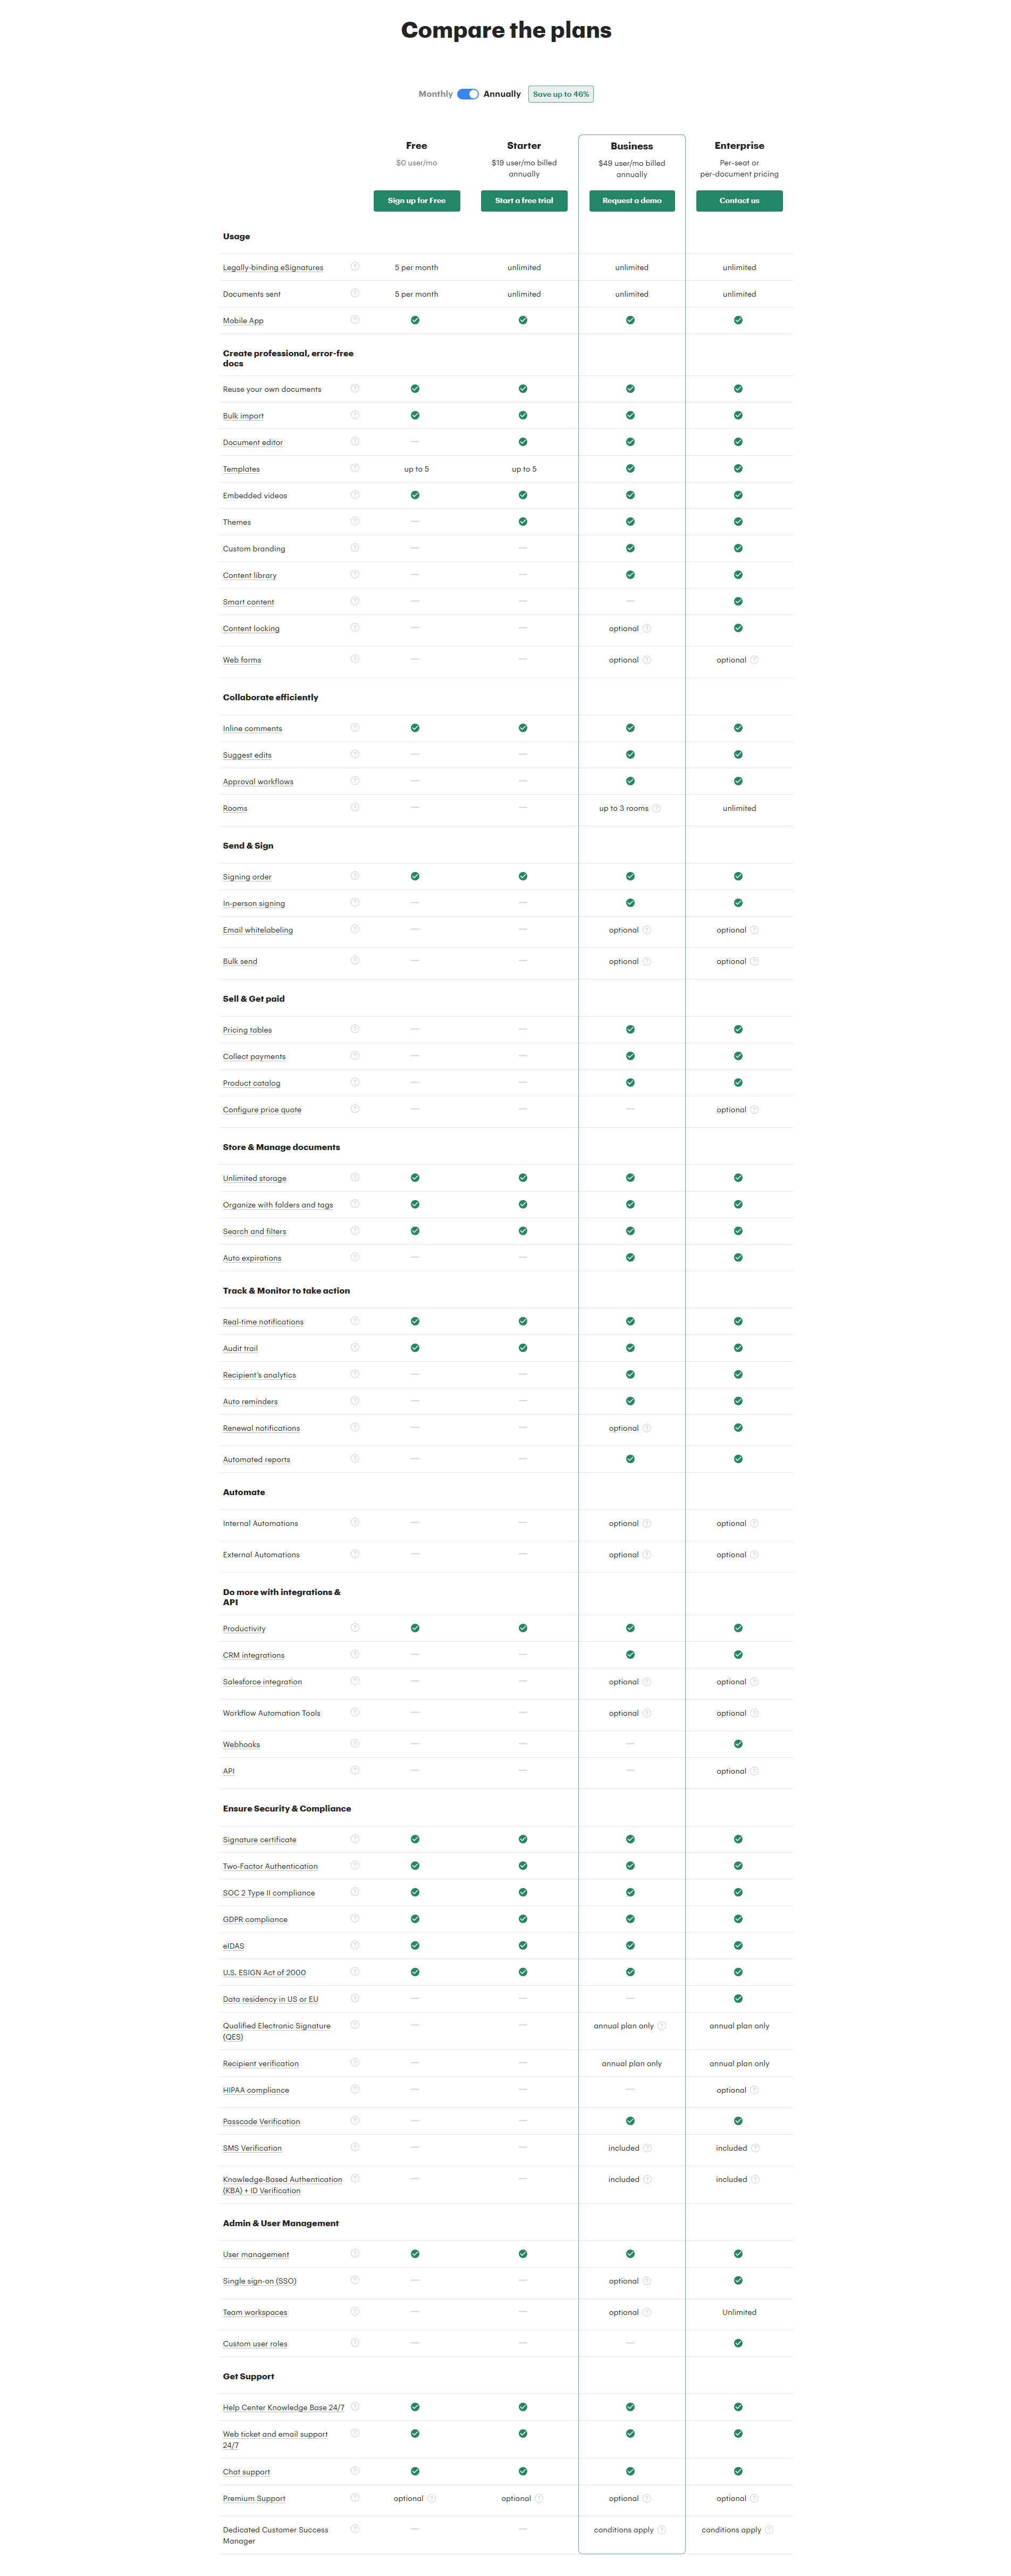
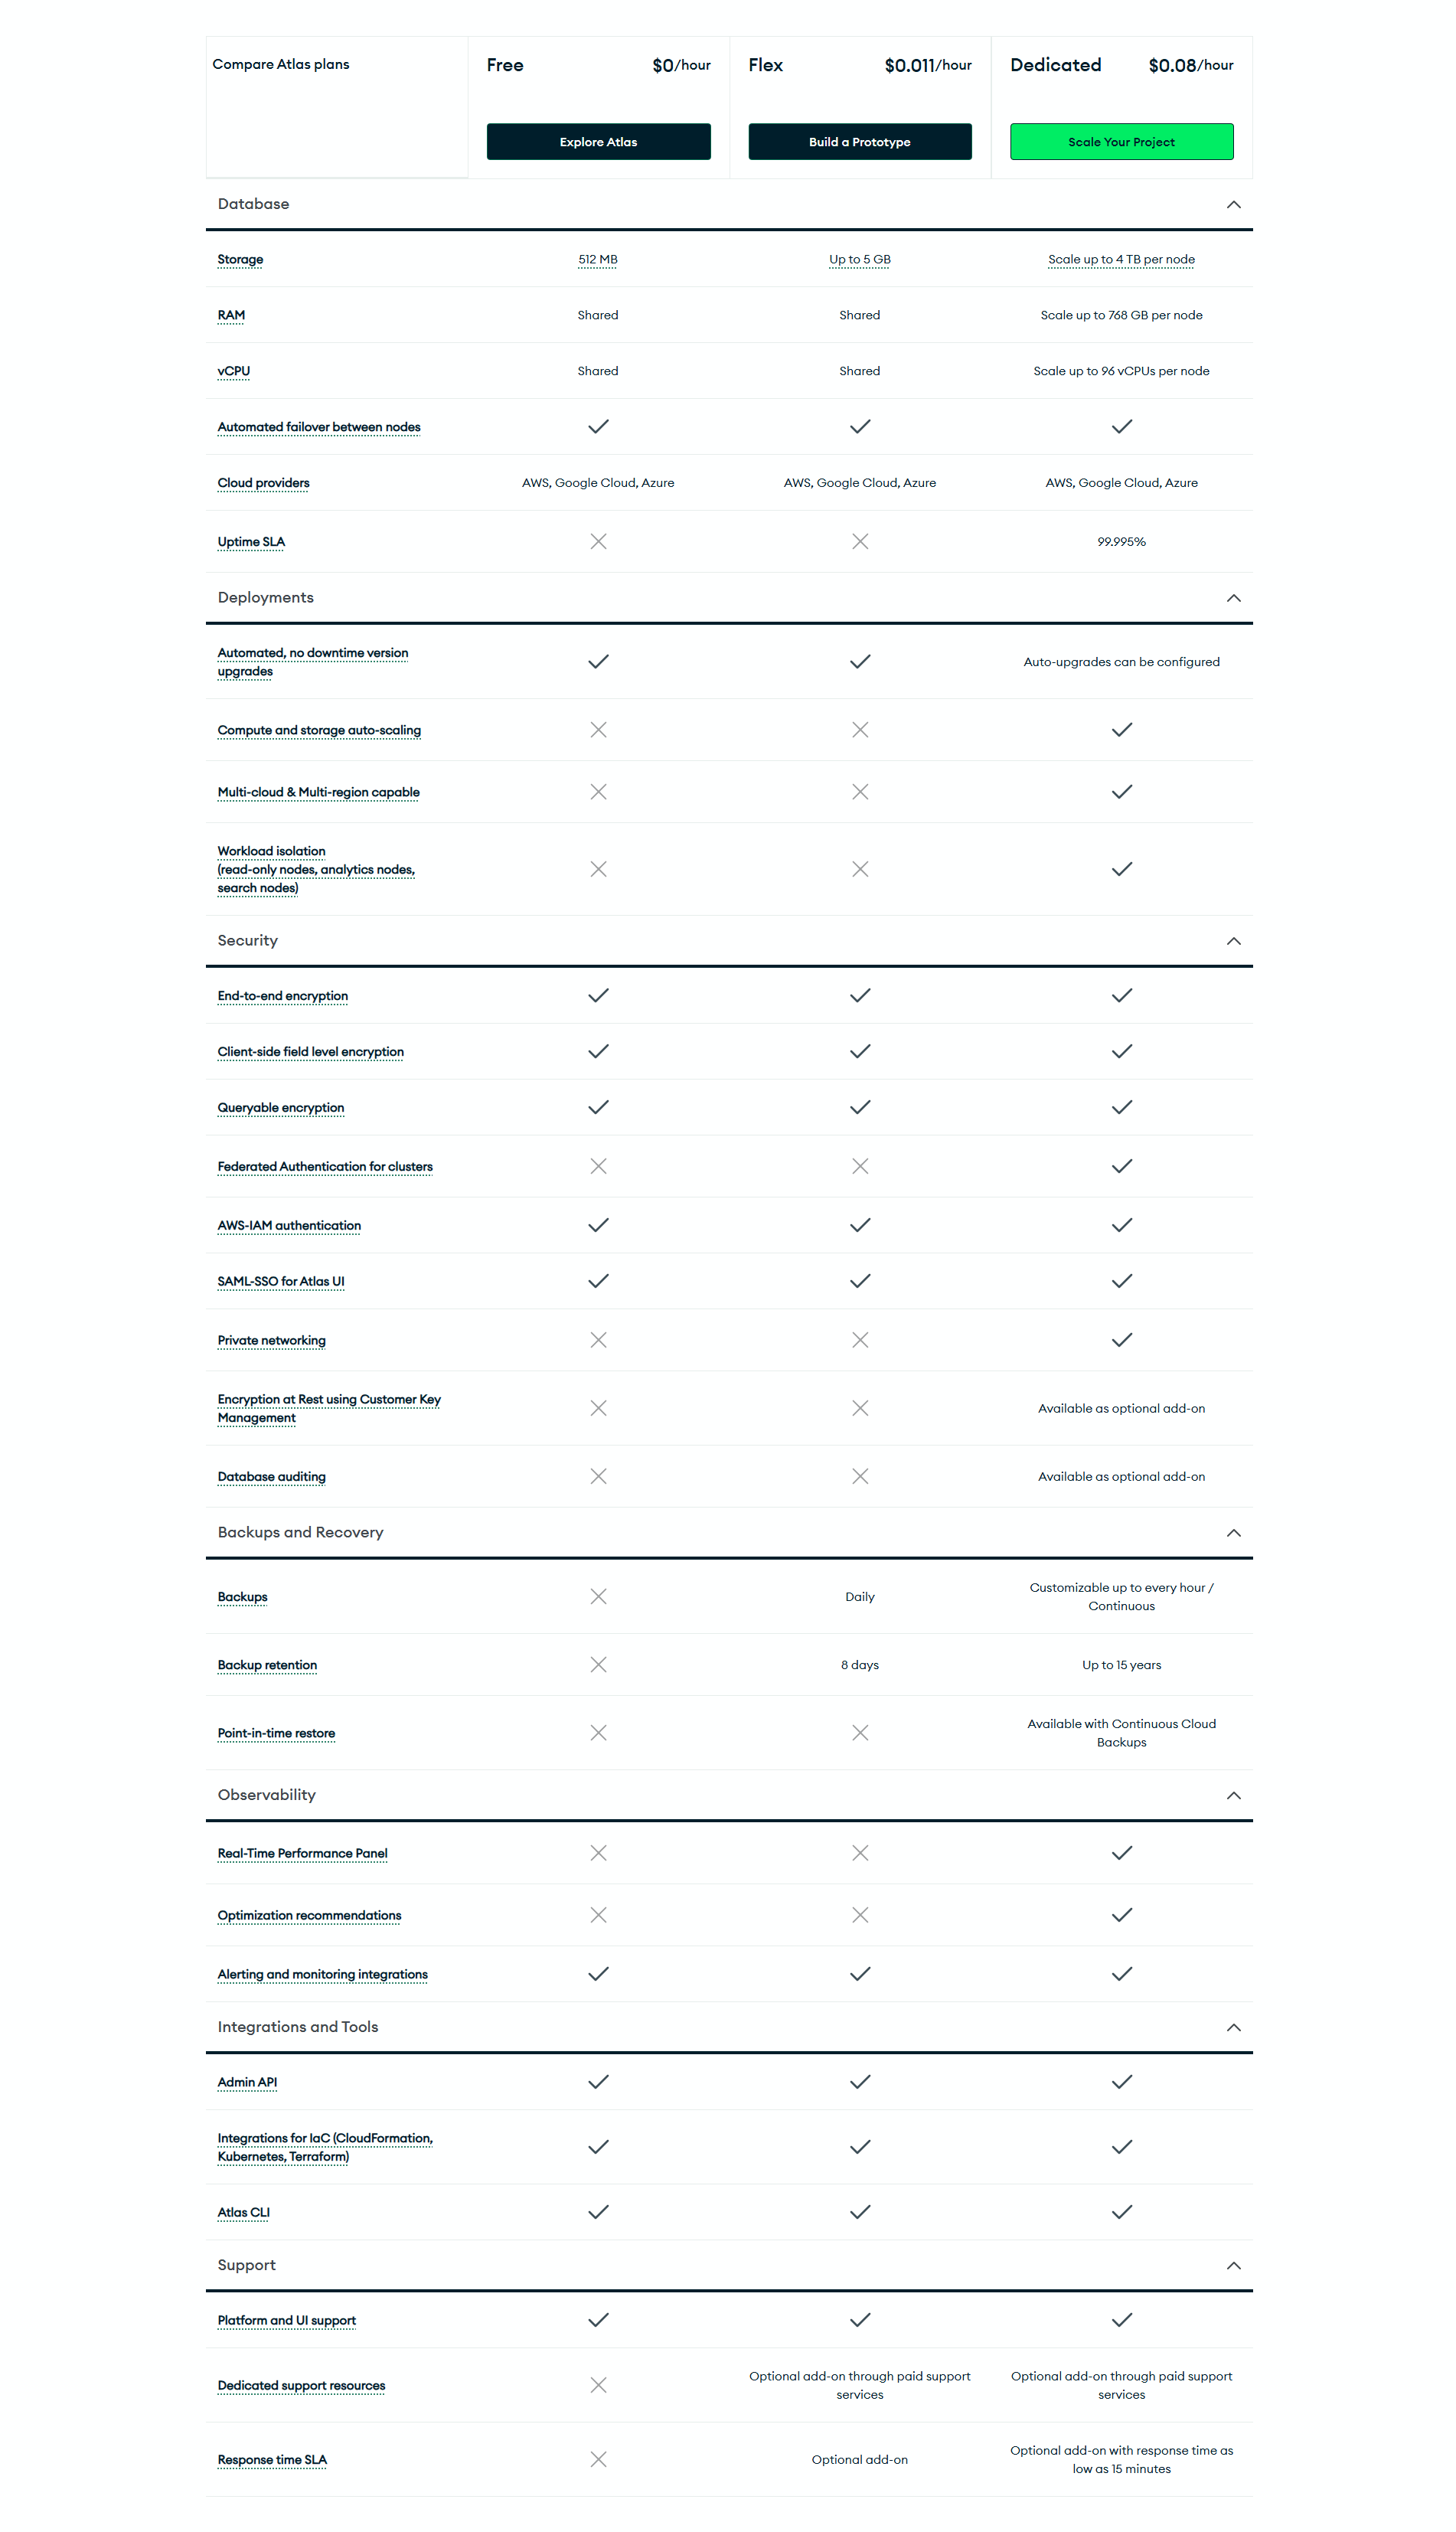
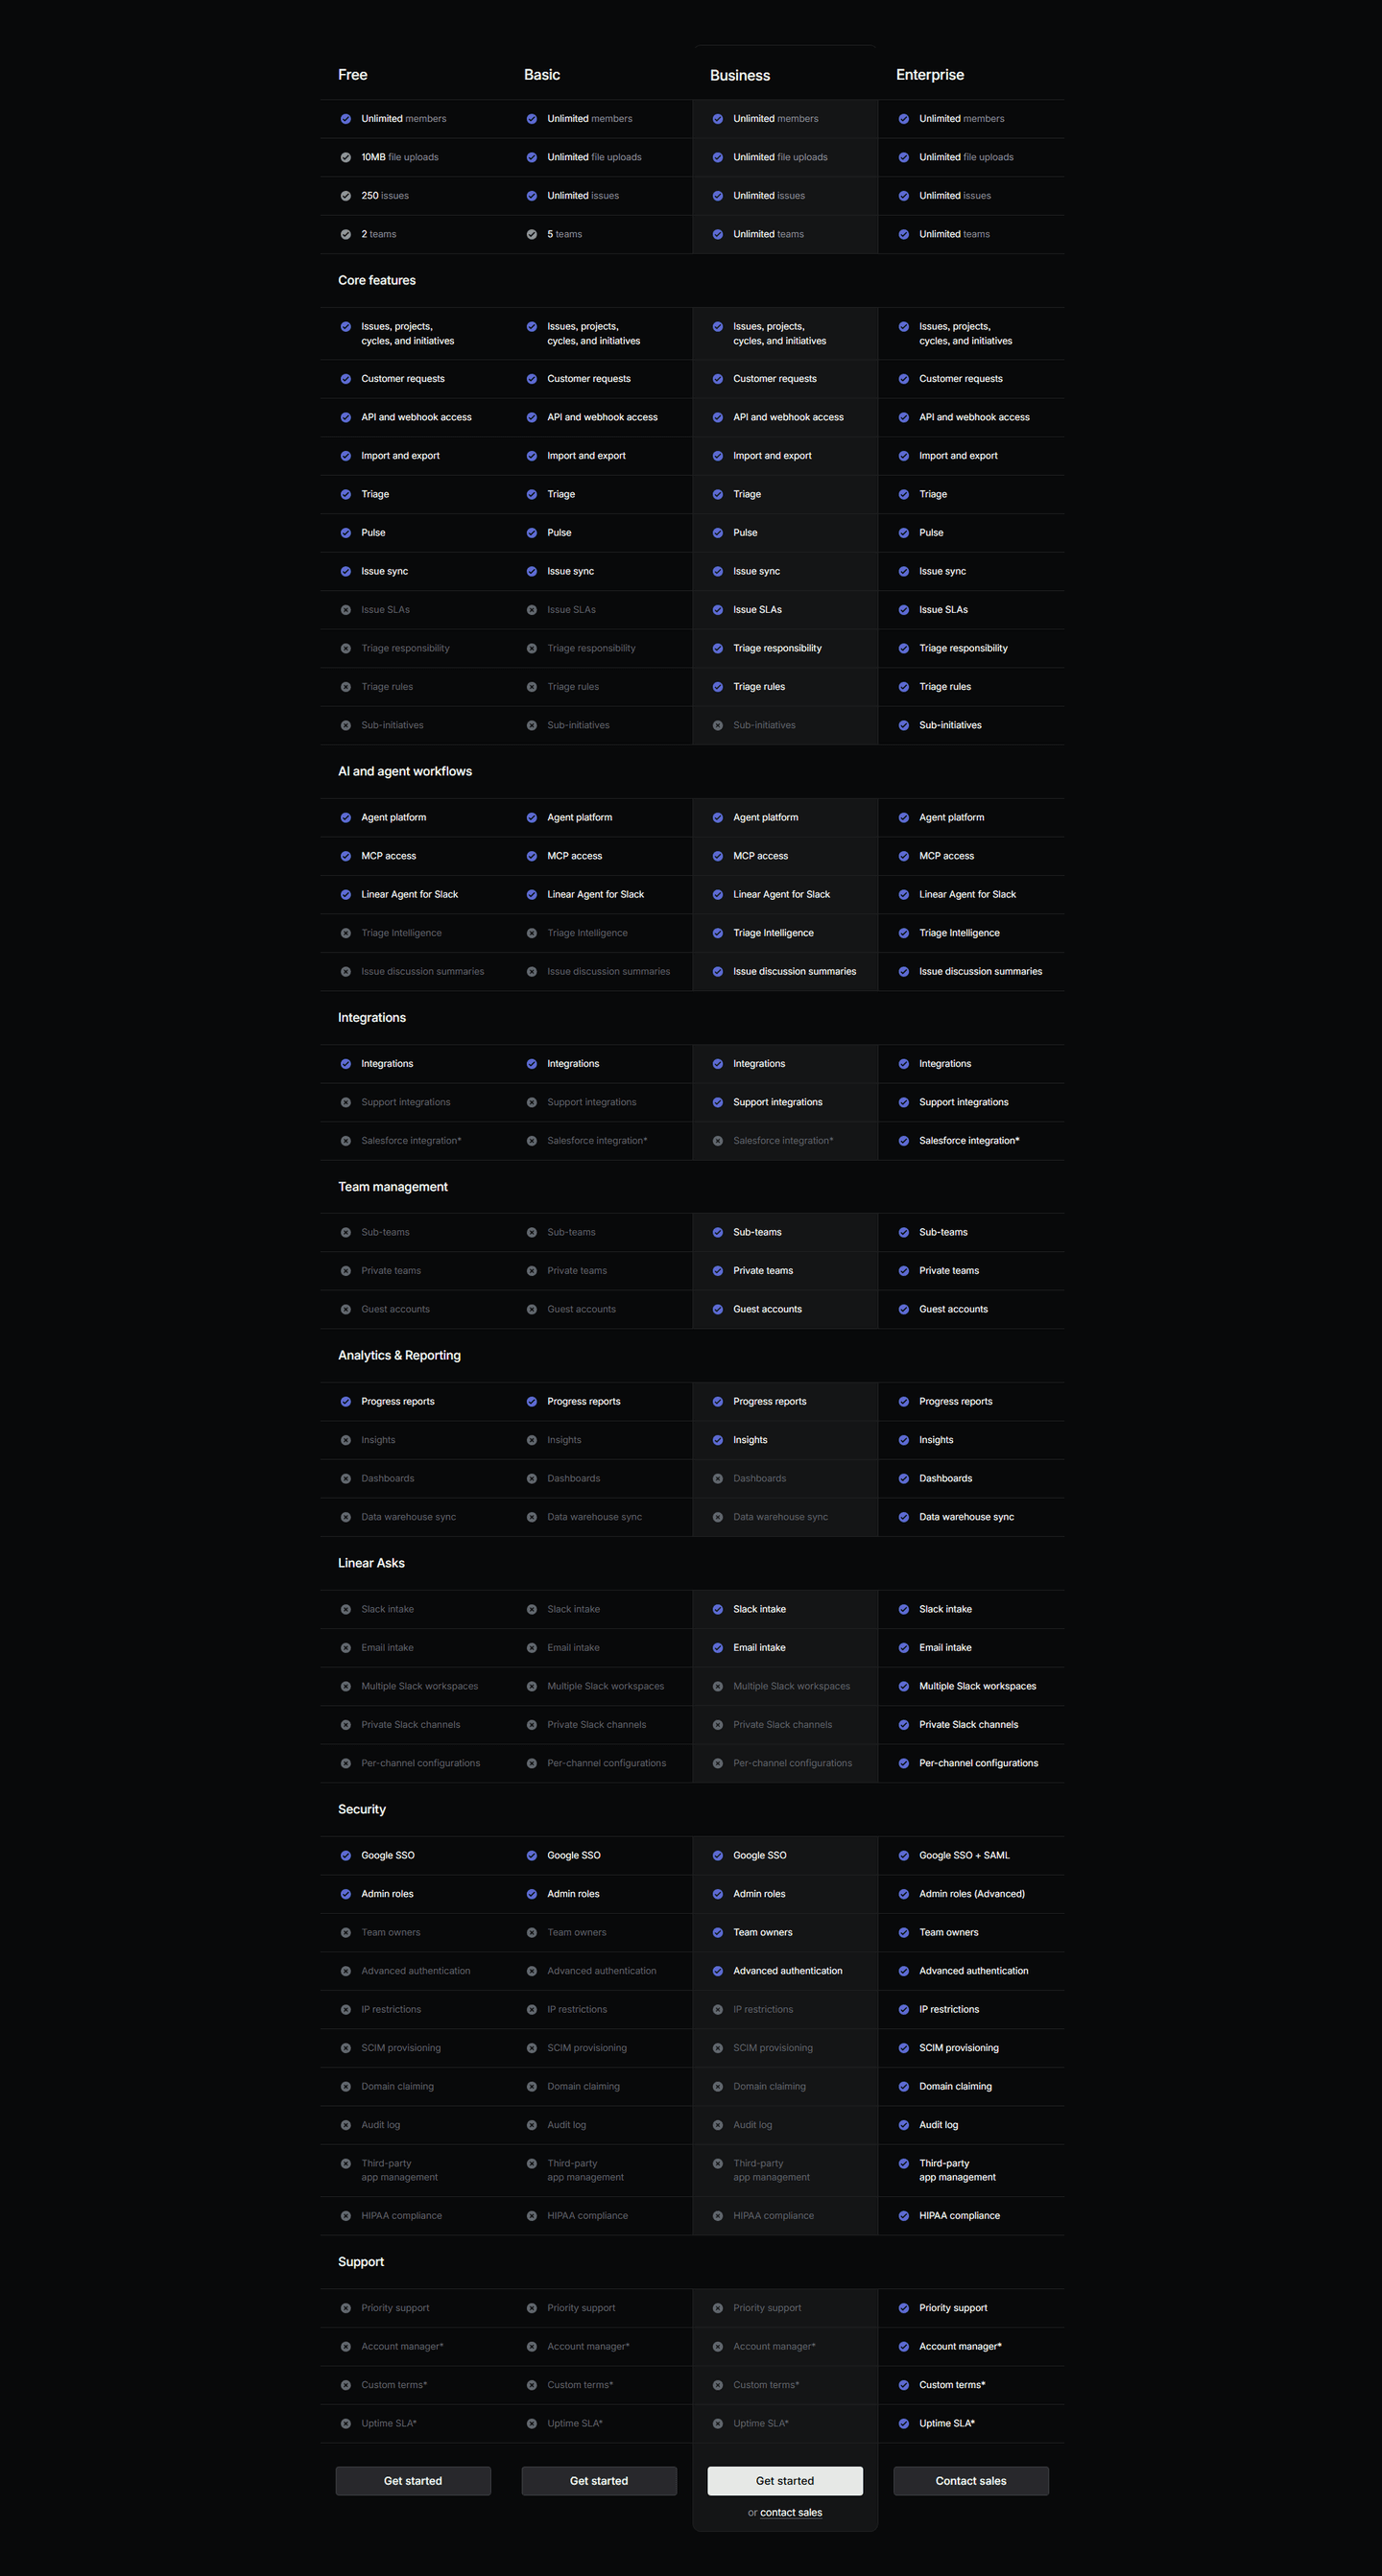
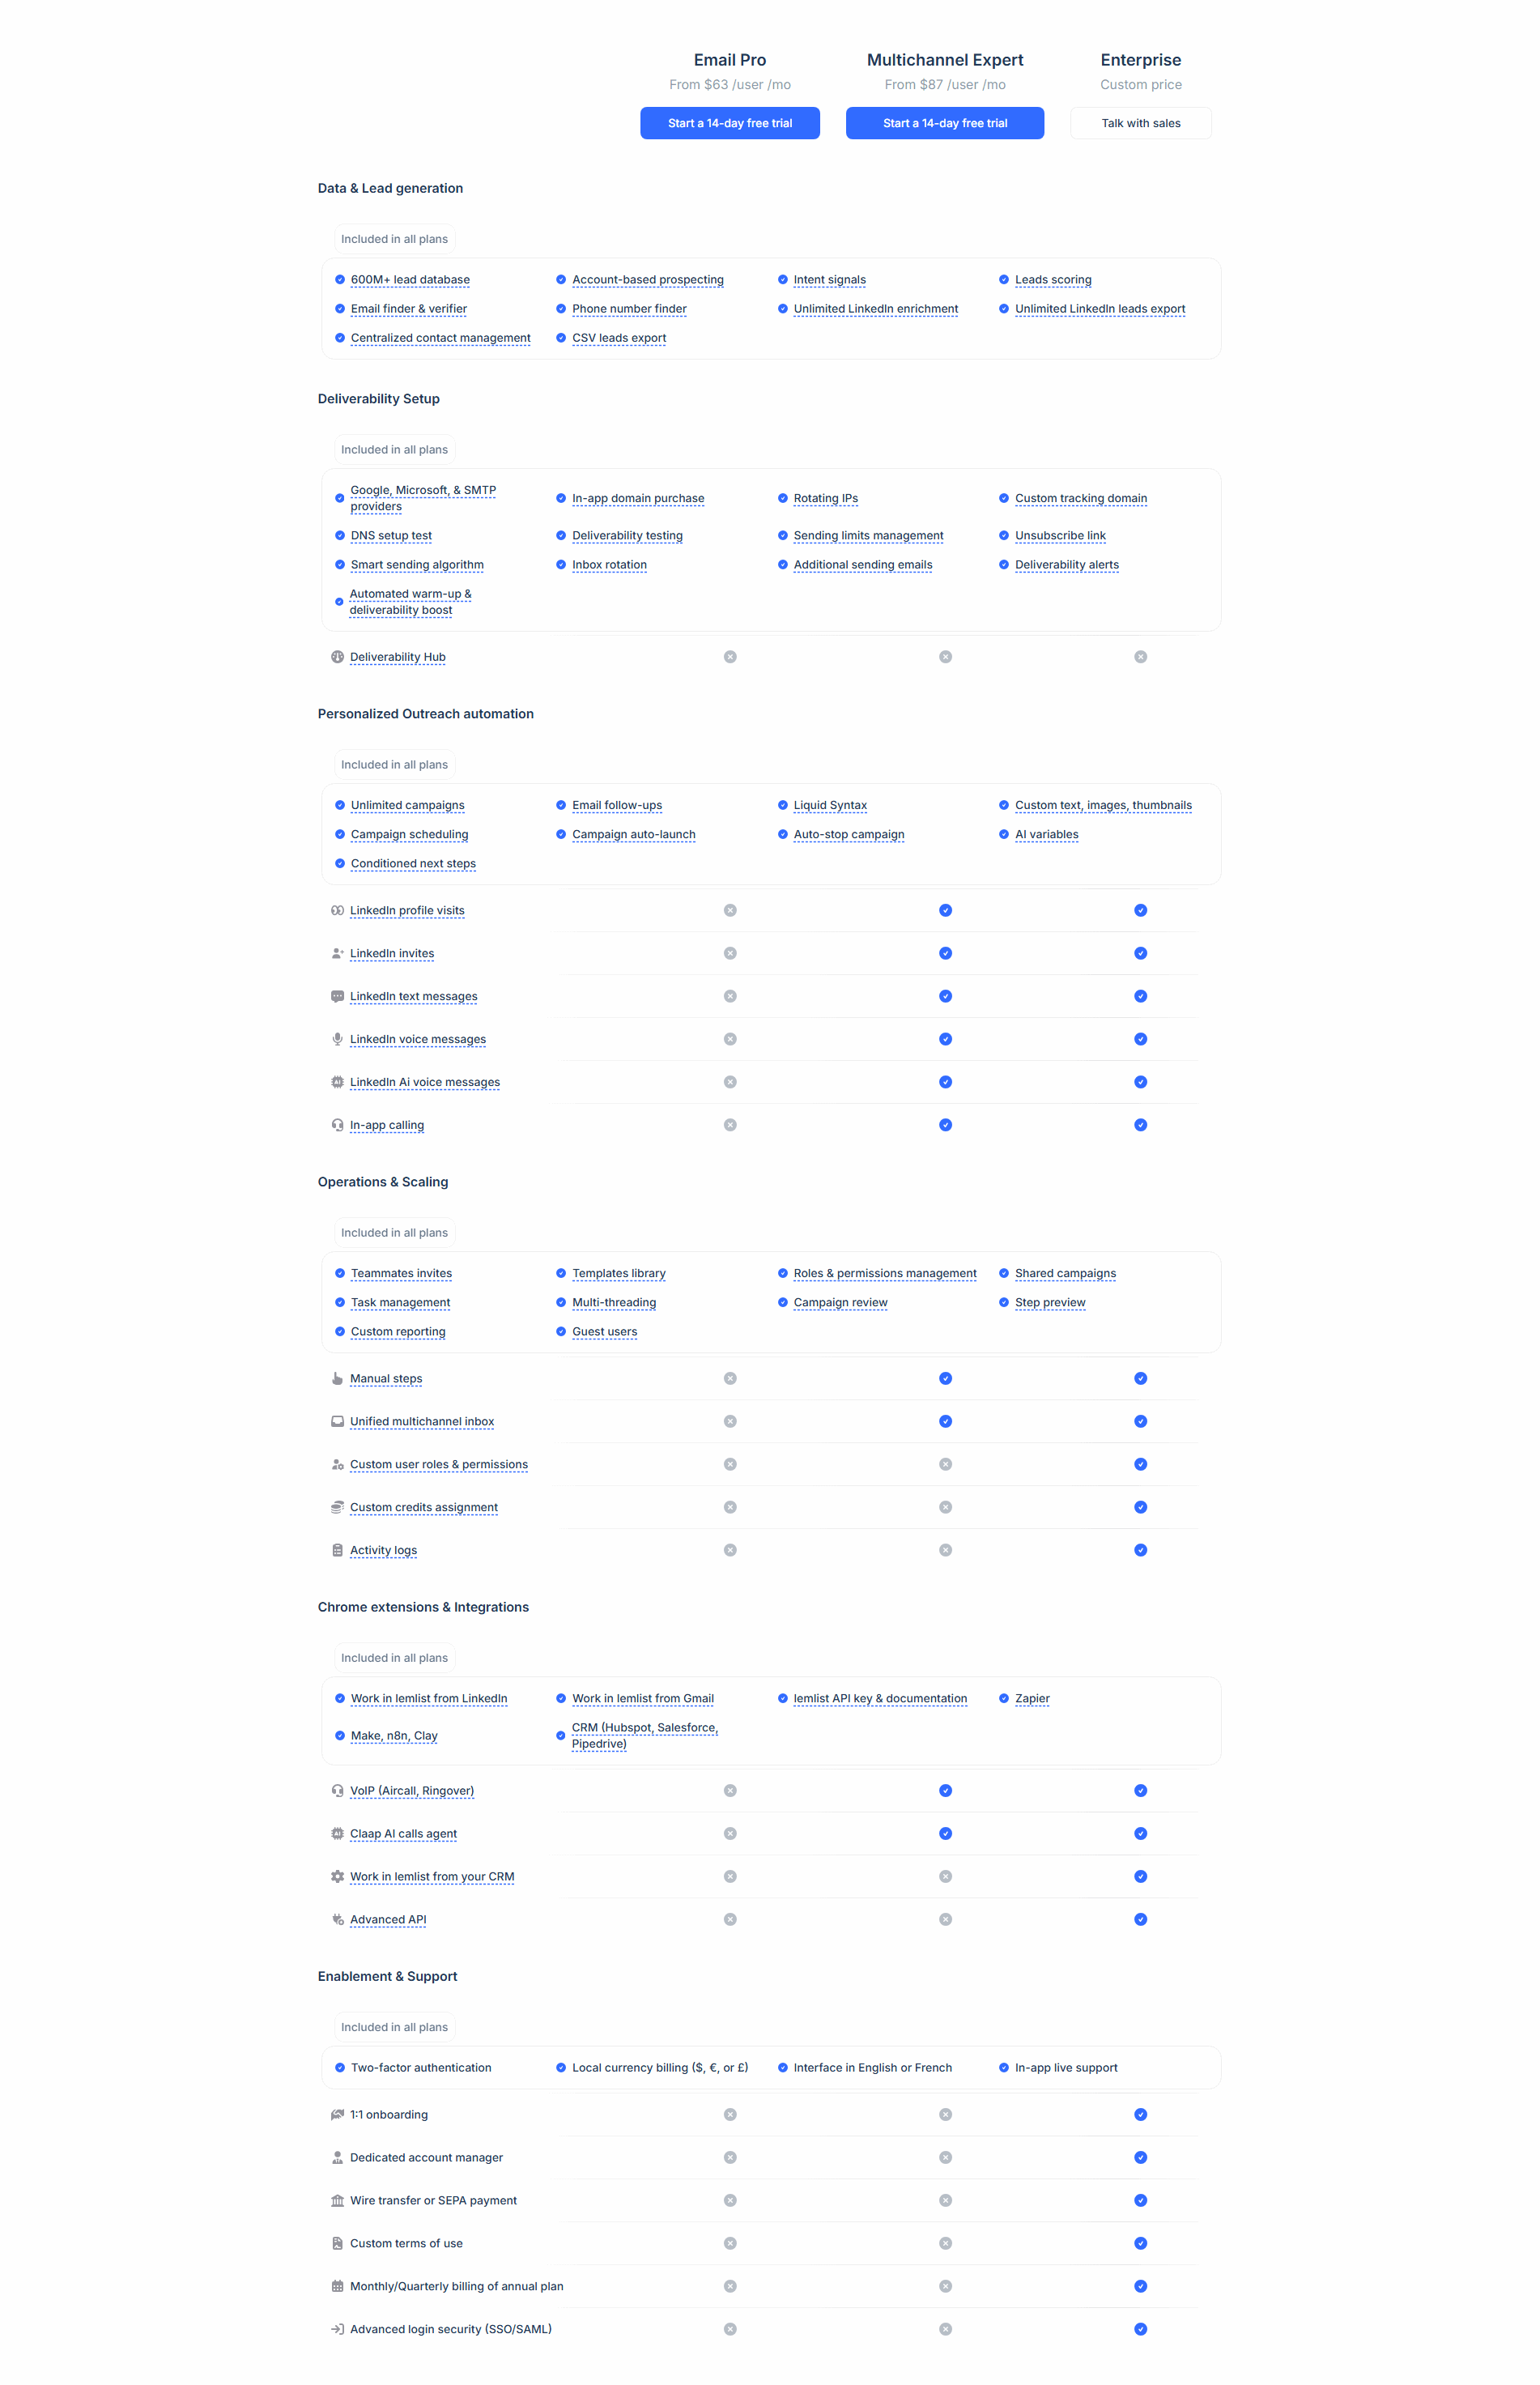
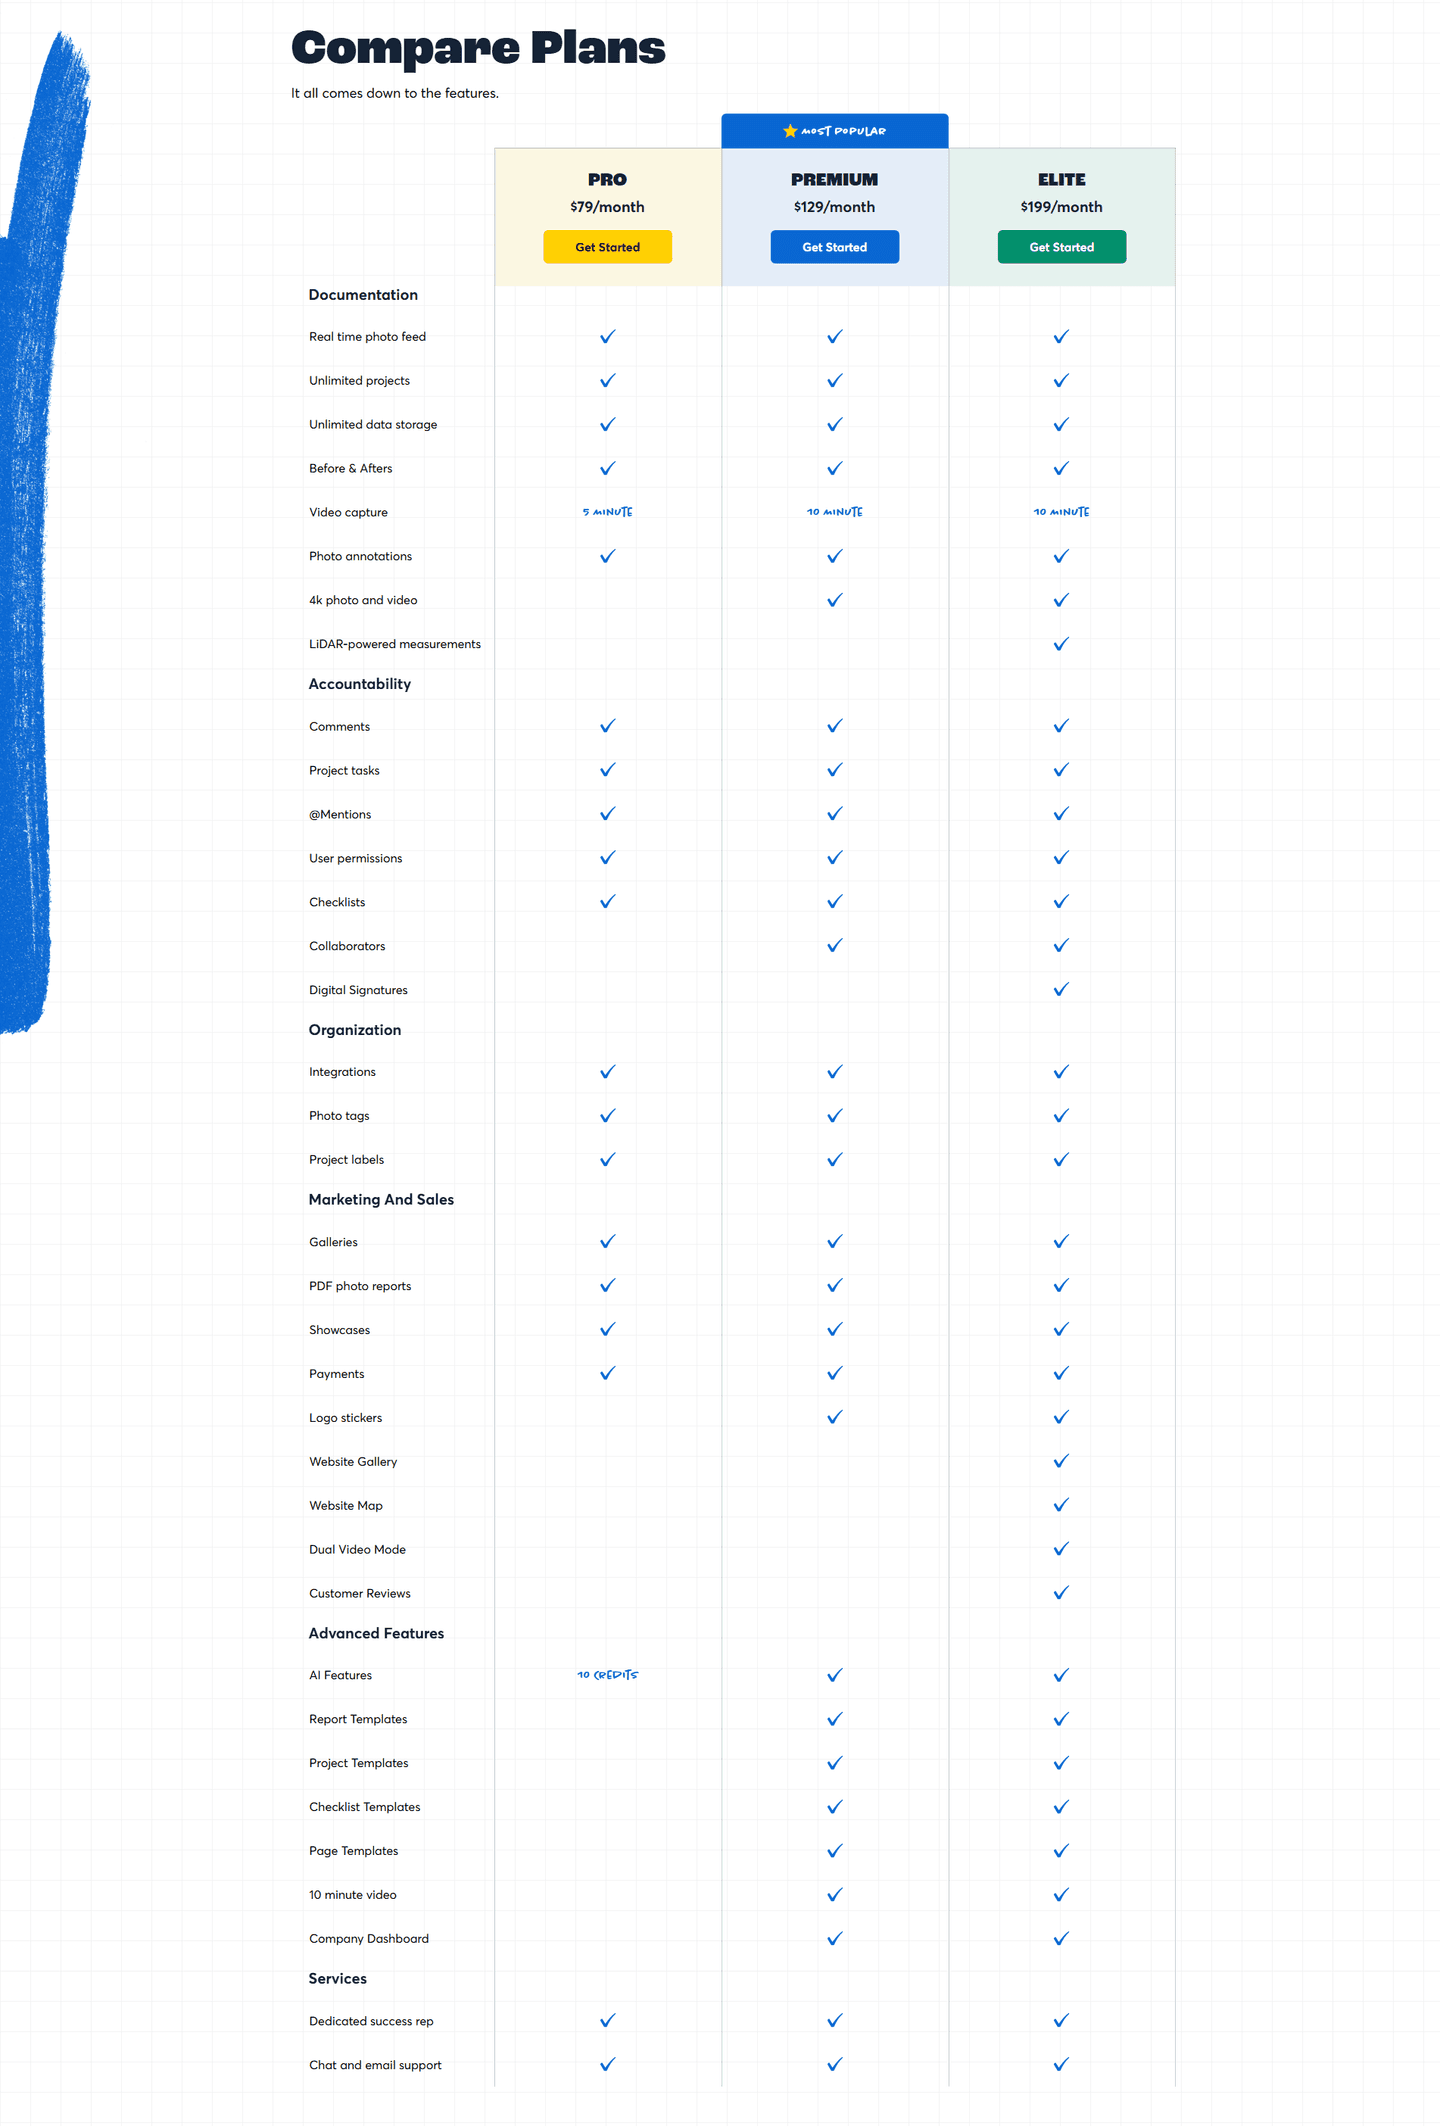
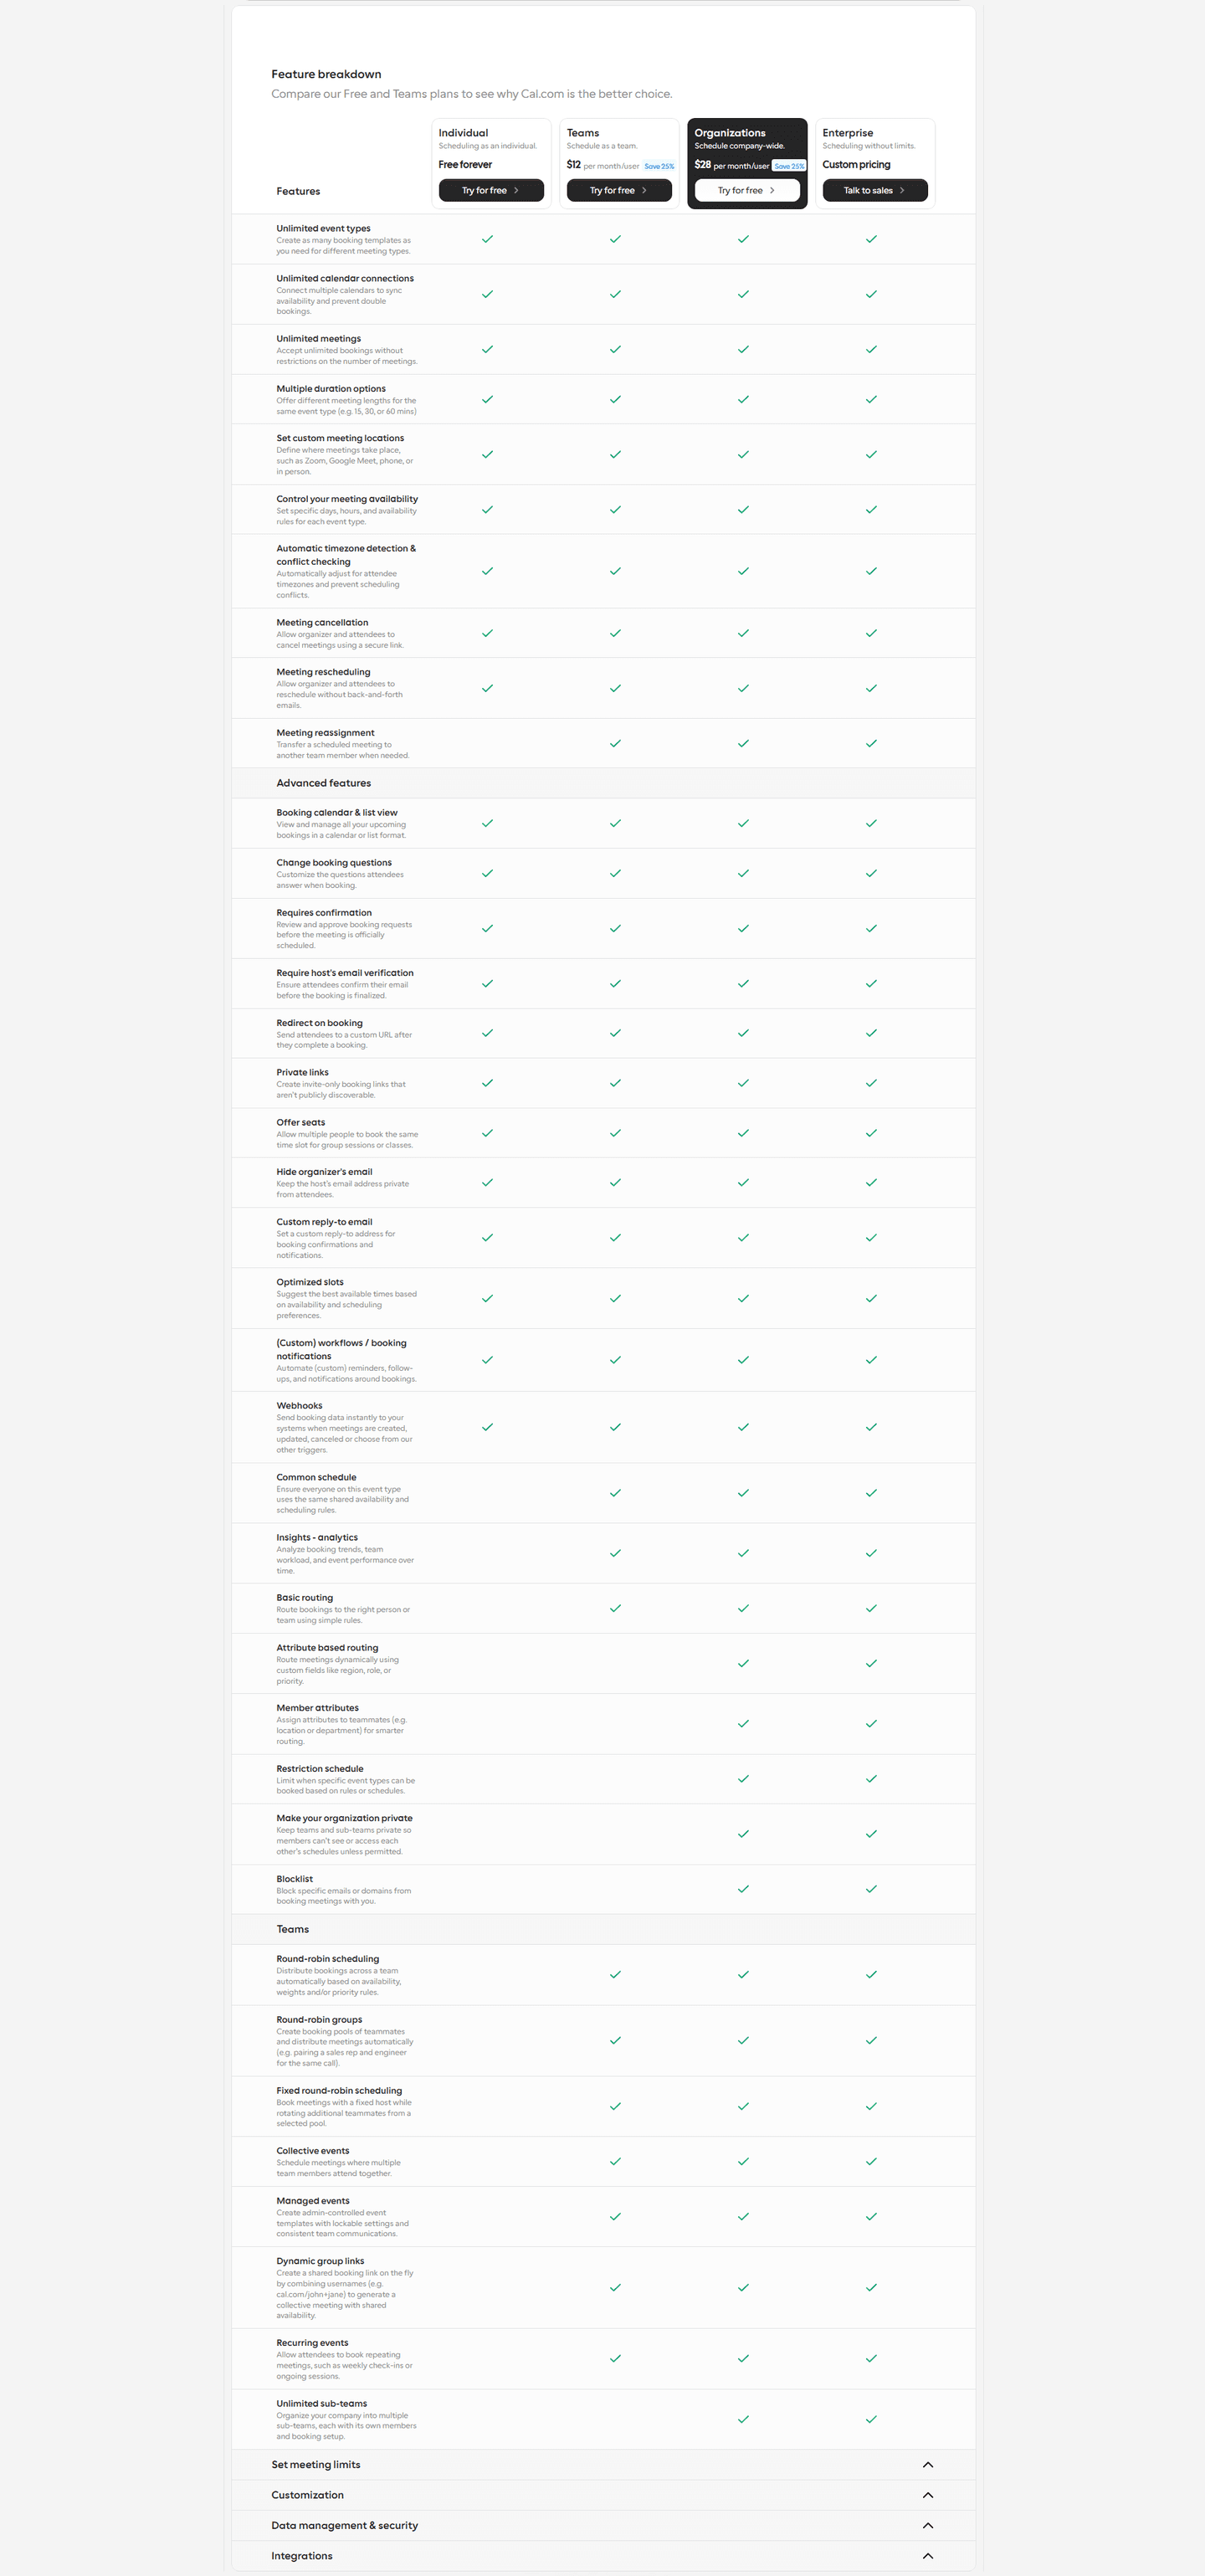
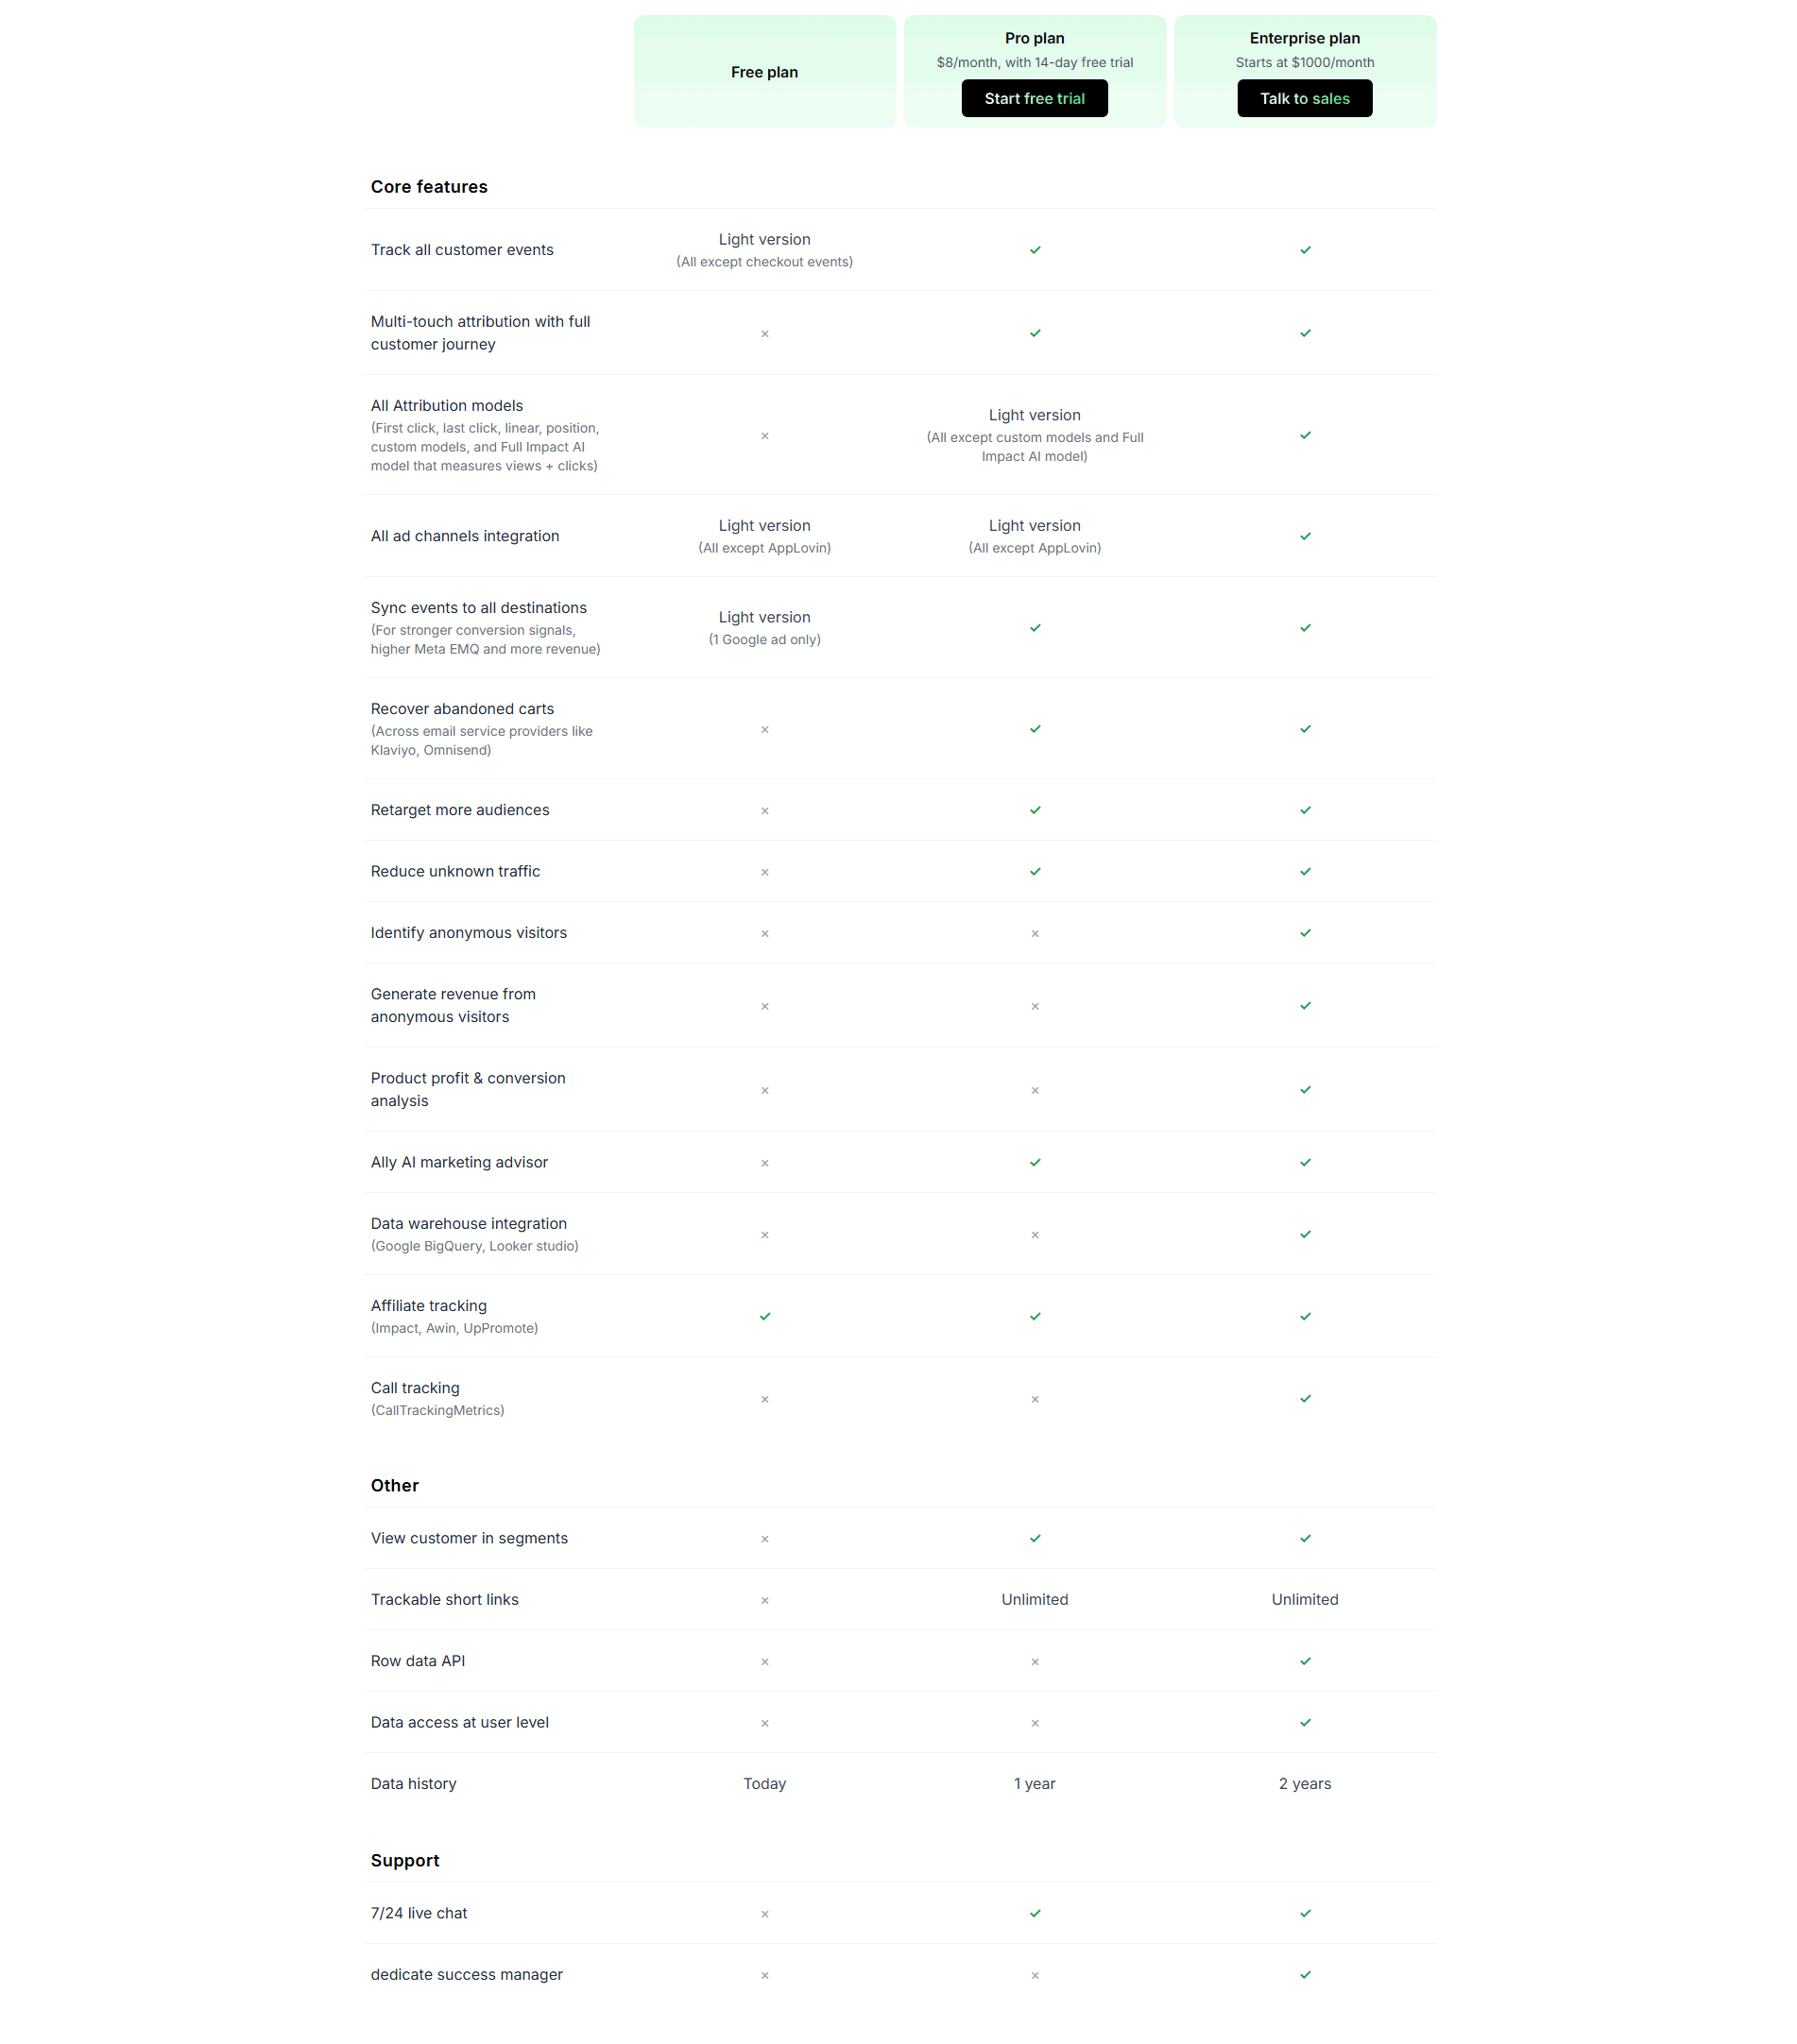
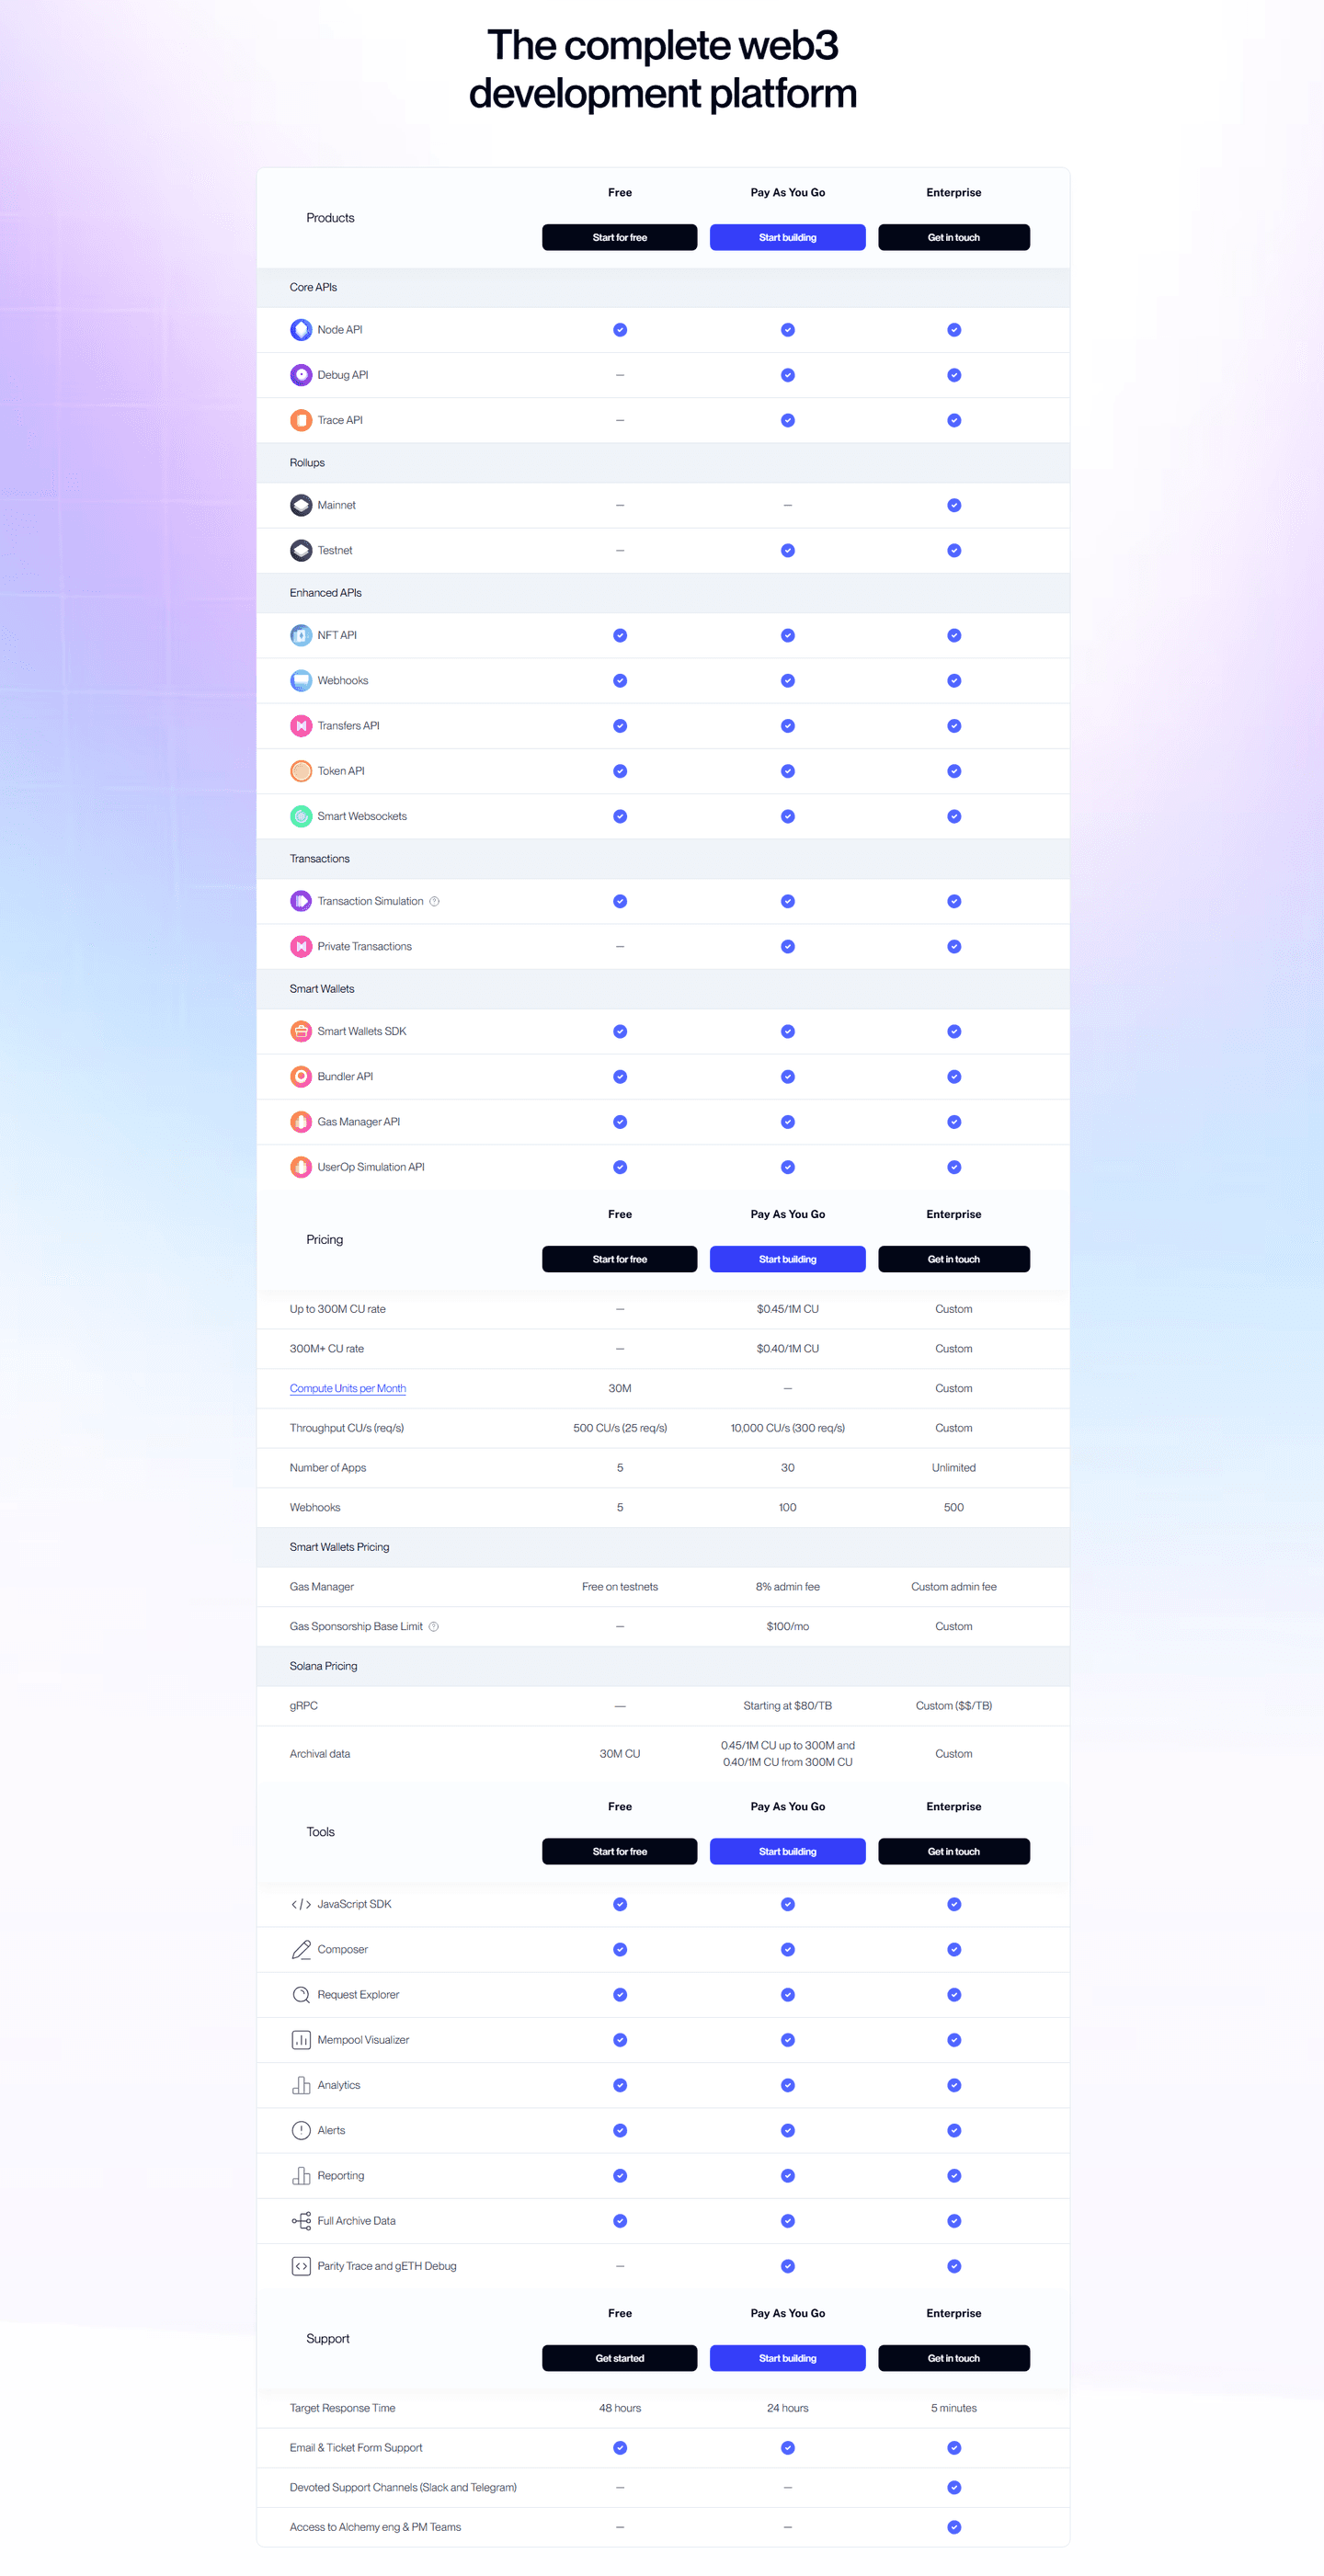
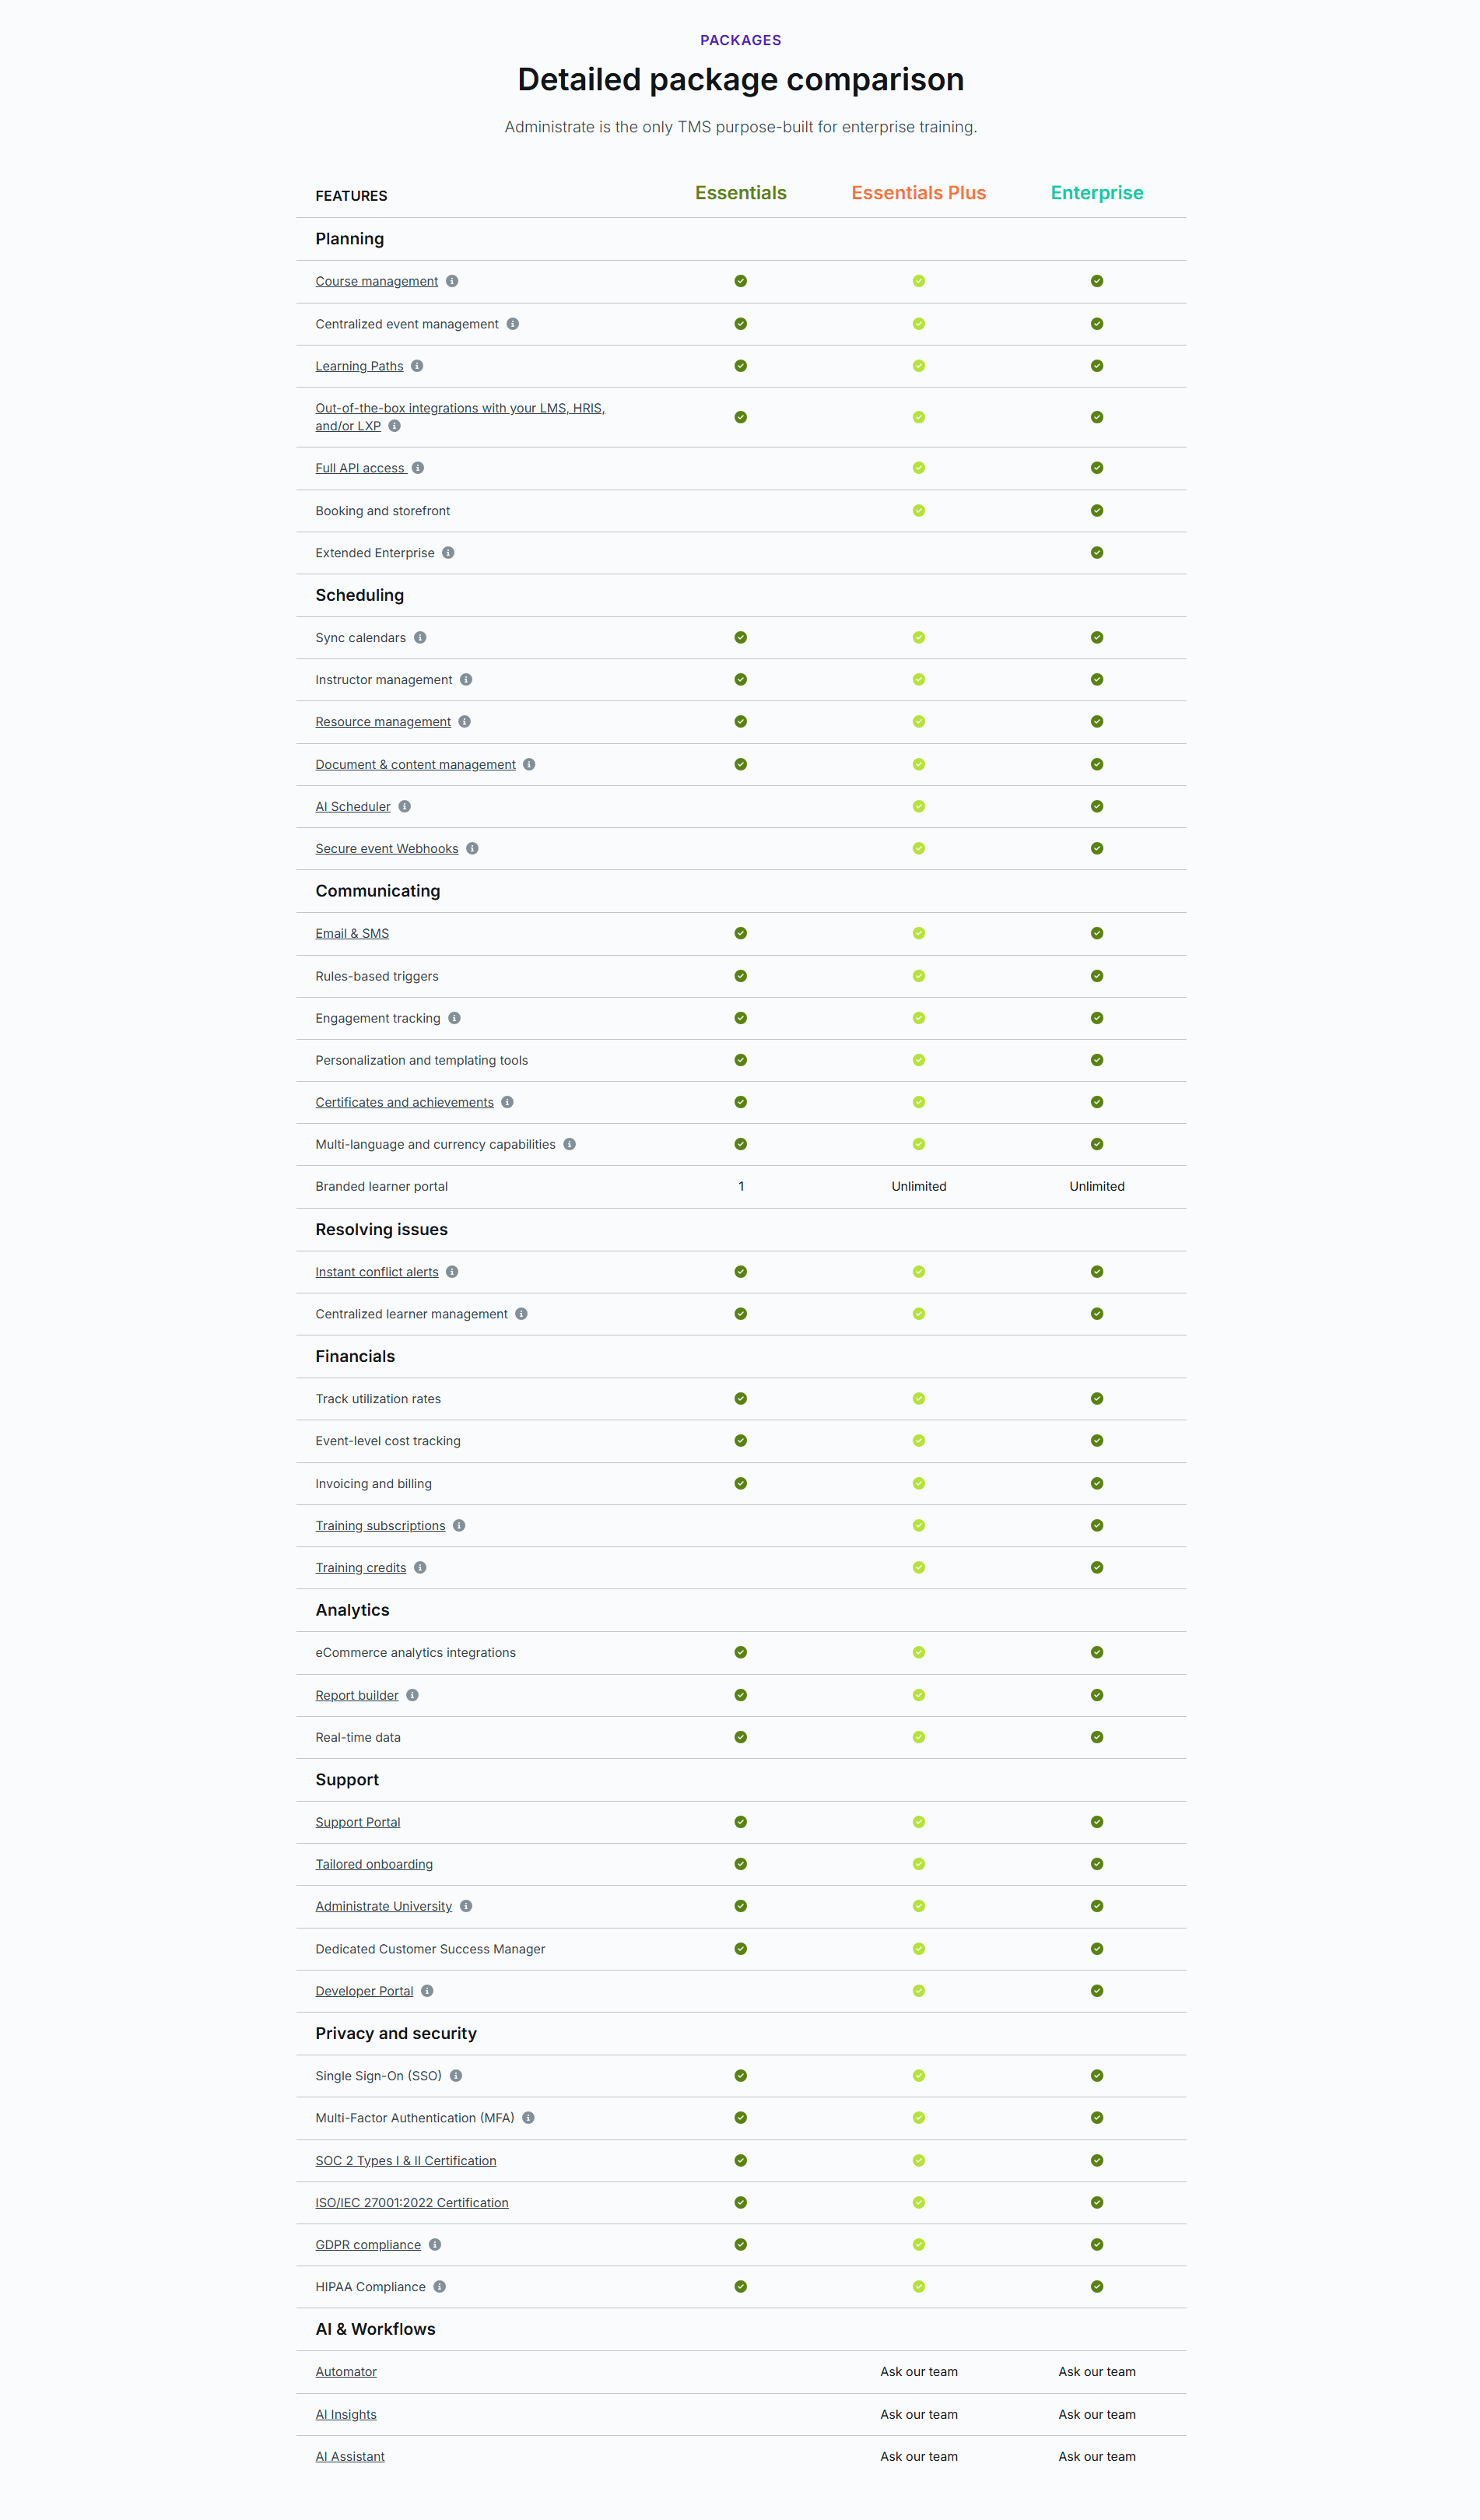


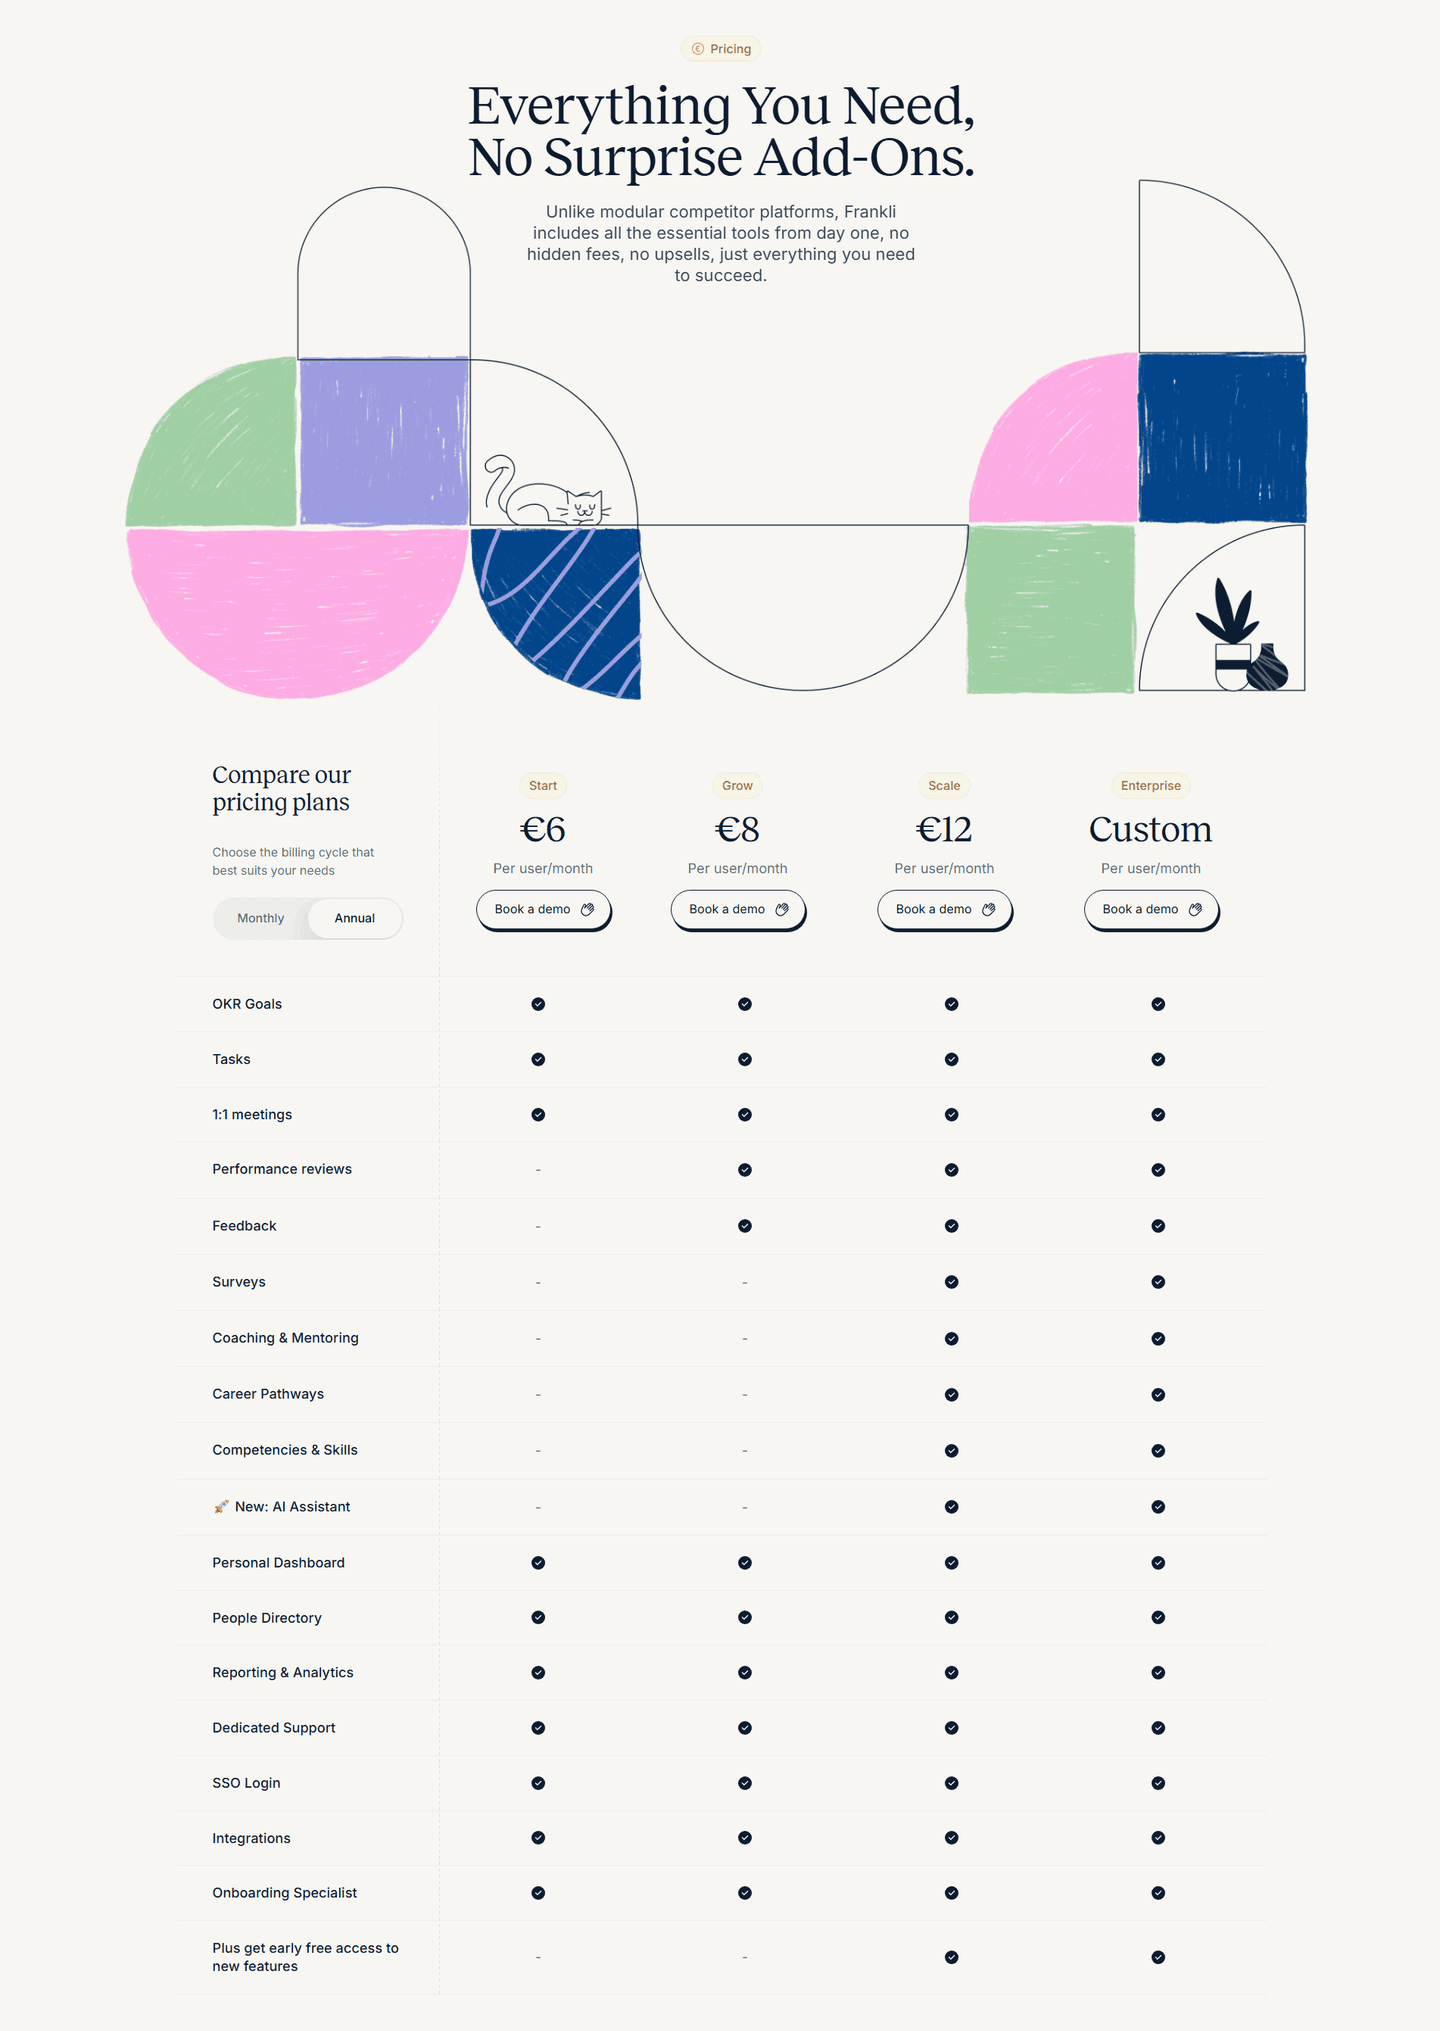


A pricing table that highlights the differences between plans is built around the gaps between tiers, not just the list of what each tier includes. A visitor opens the pricing page to answer one question: which plan do I need, and what do I give up if I pick the cheaper one? A table that highlights the differences answers it at a glance.
The best pricing tables use a few forms, usually together:
Choosing a plan is a comparison, not a read. When every column looks alike, the visitor has to work out the difference row by row. When the differences are marked, the table does the comparing for them.
A marked difference is also the reason to upgrade. When a buyer can see that the middle plan is the one that unlocks the feature they came for, the price stops being an abstract number and becomes the cost of something specific they want.
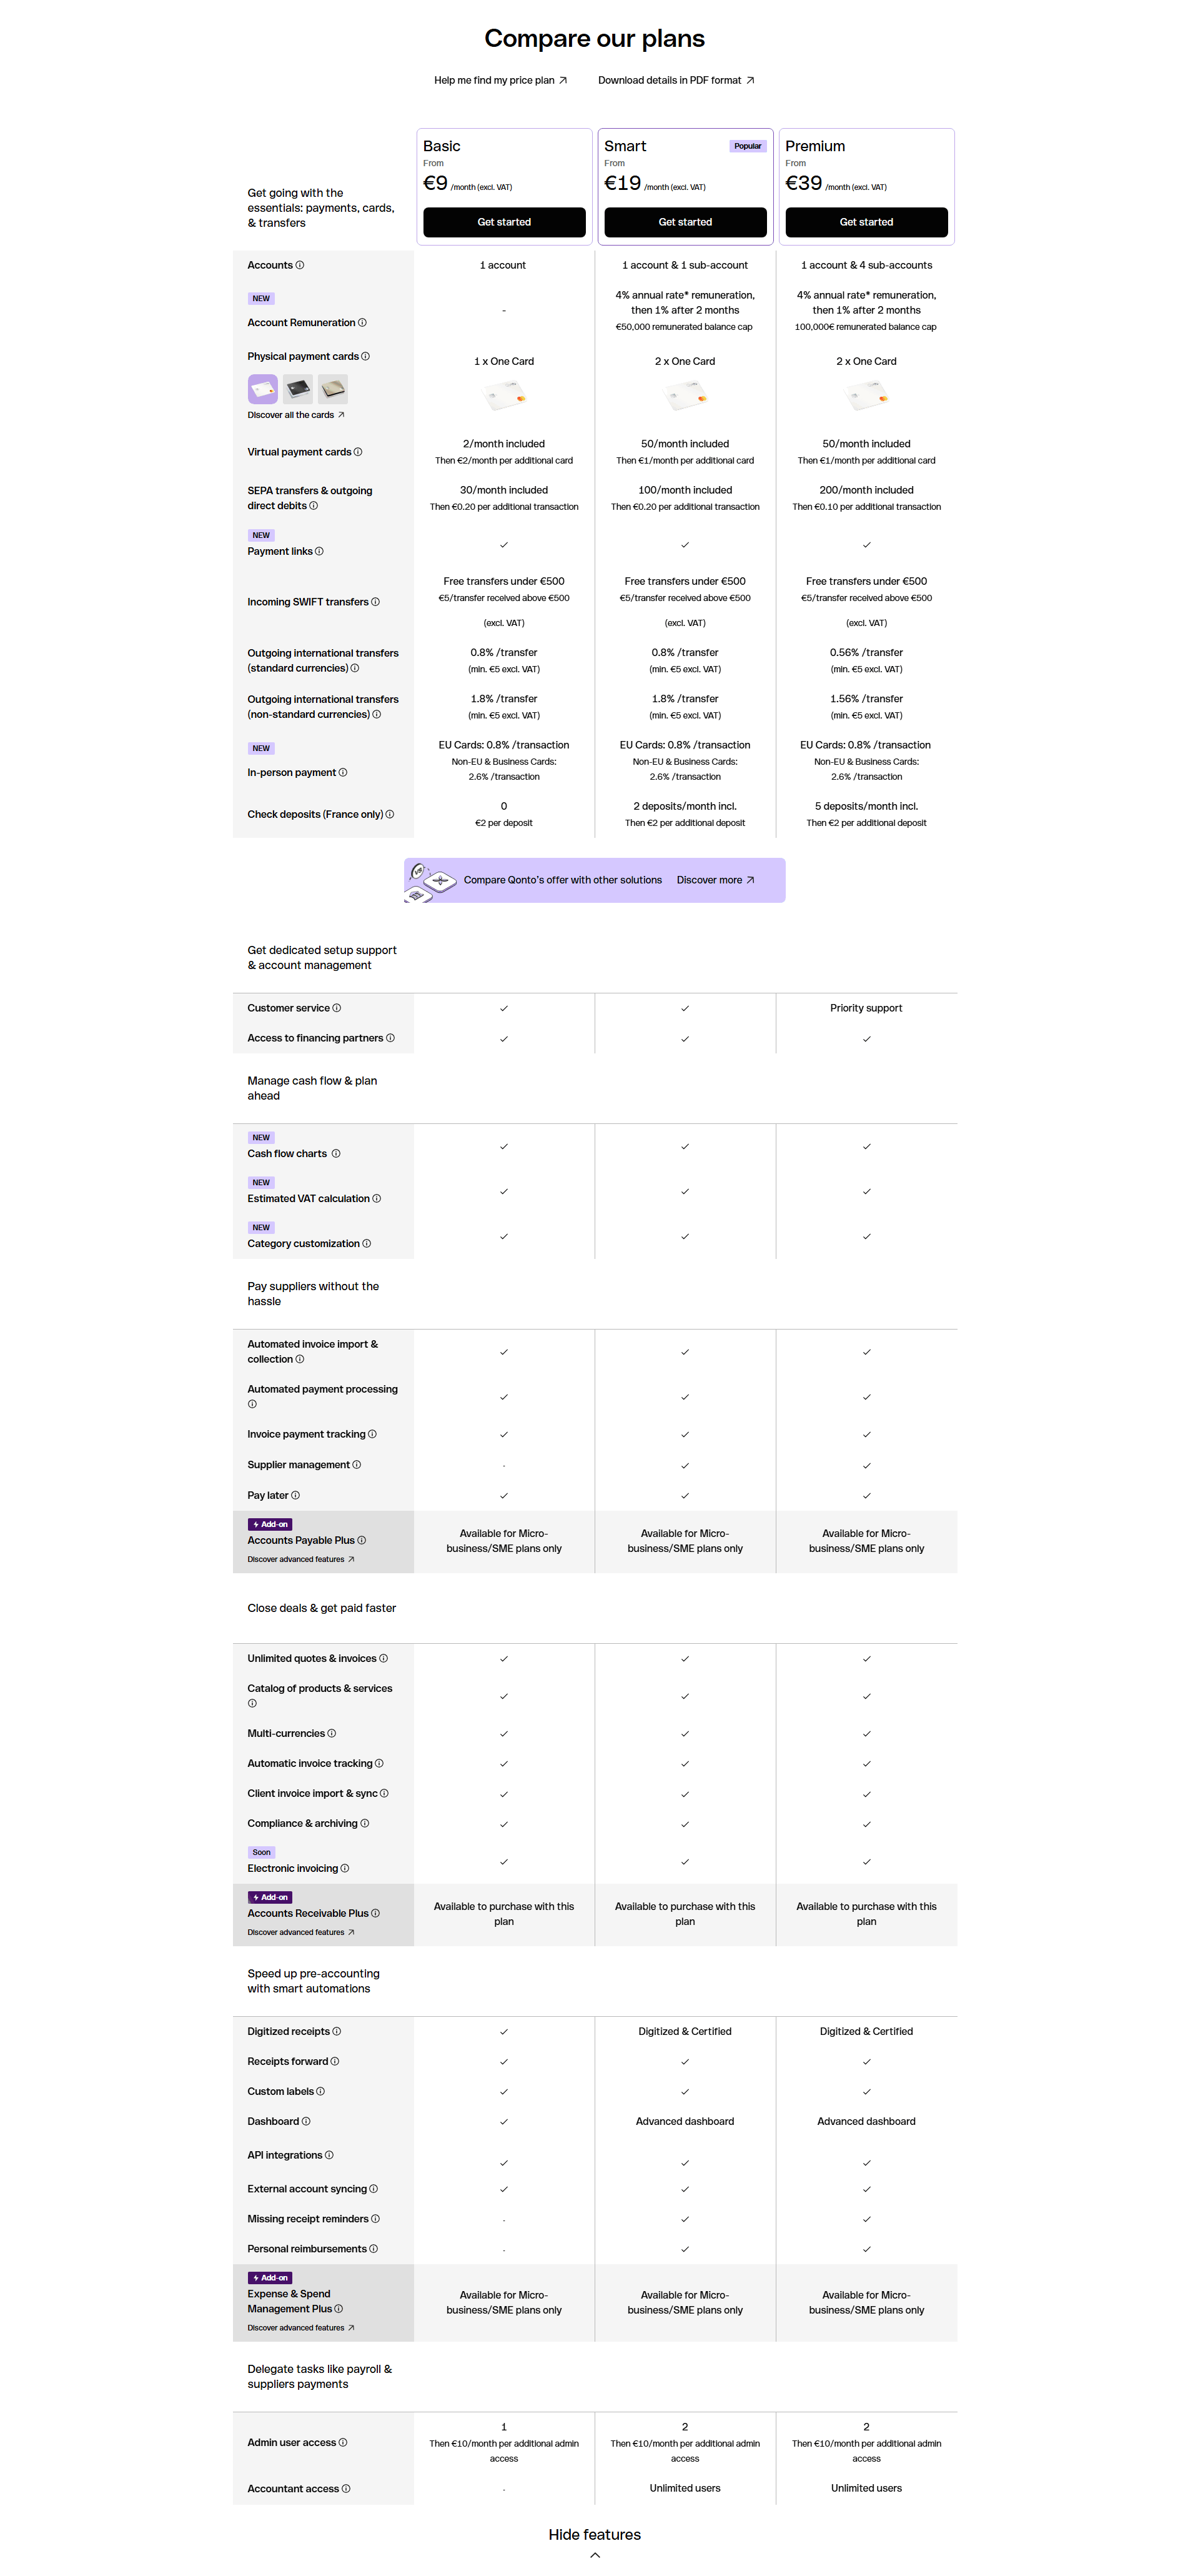
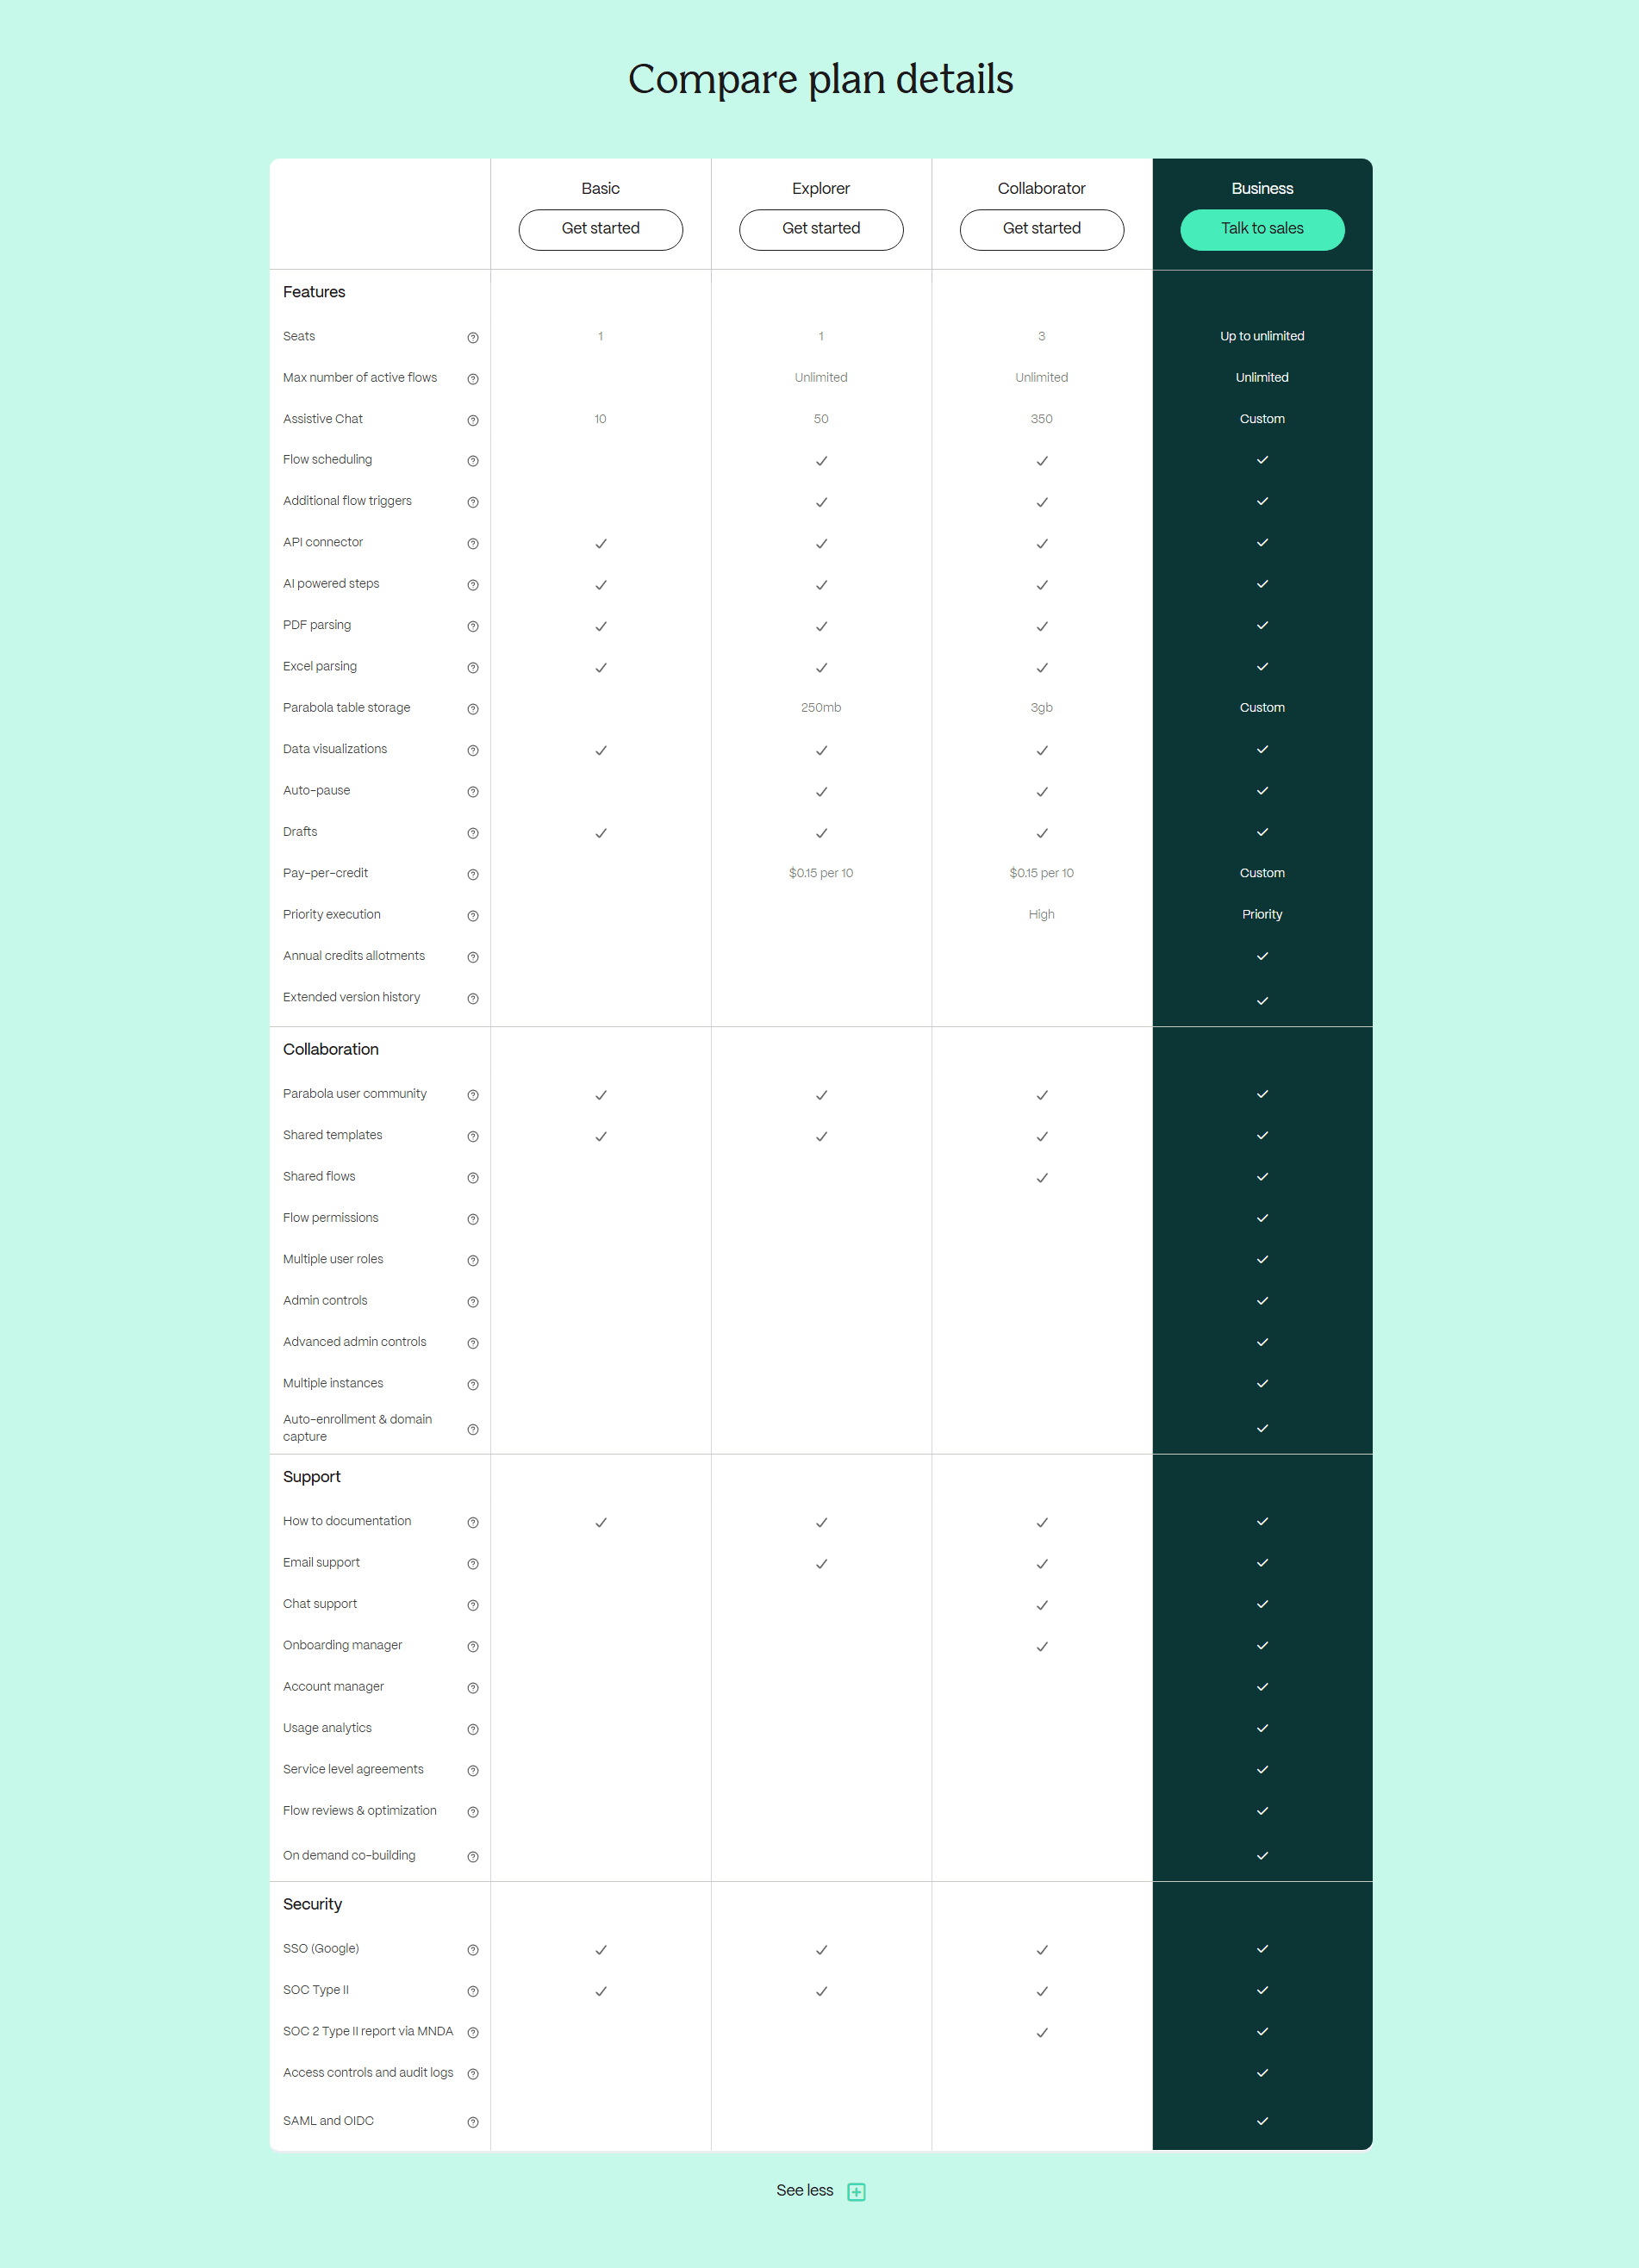
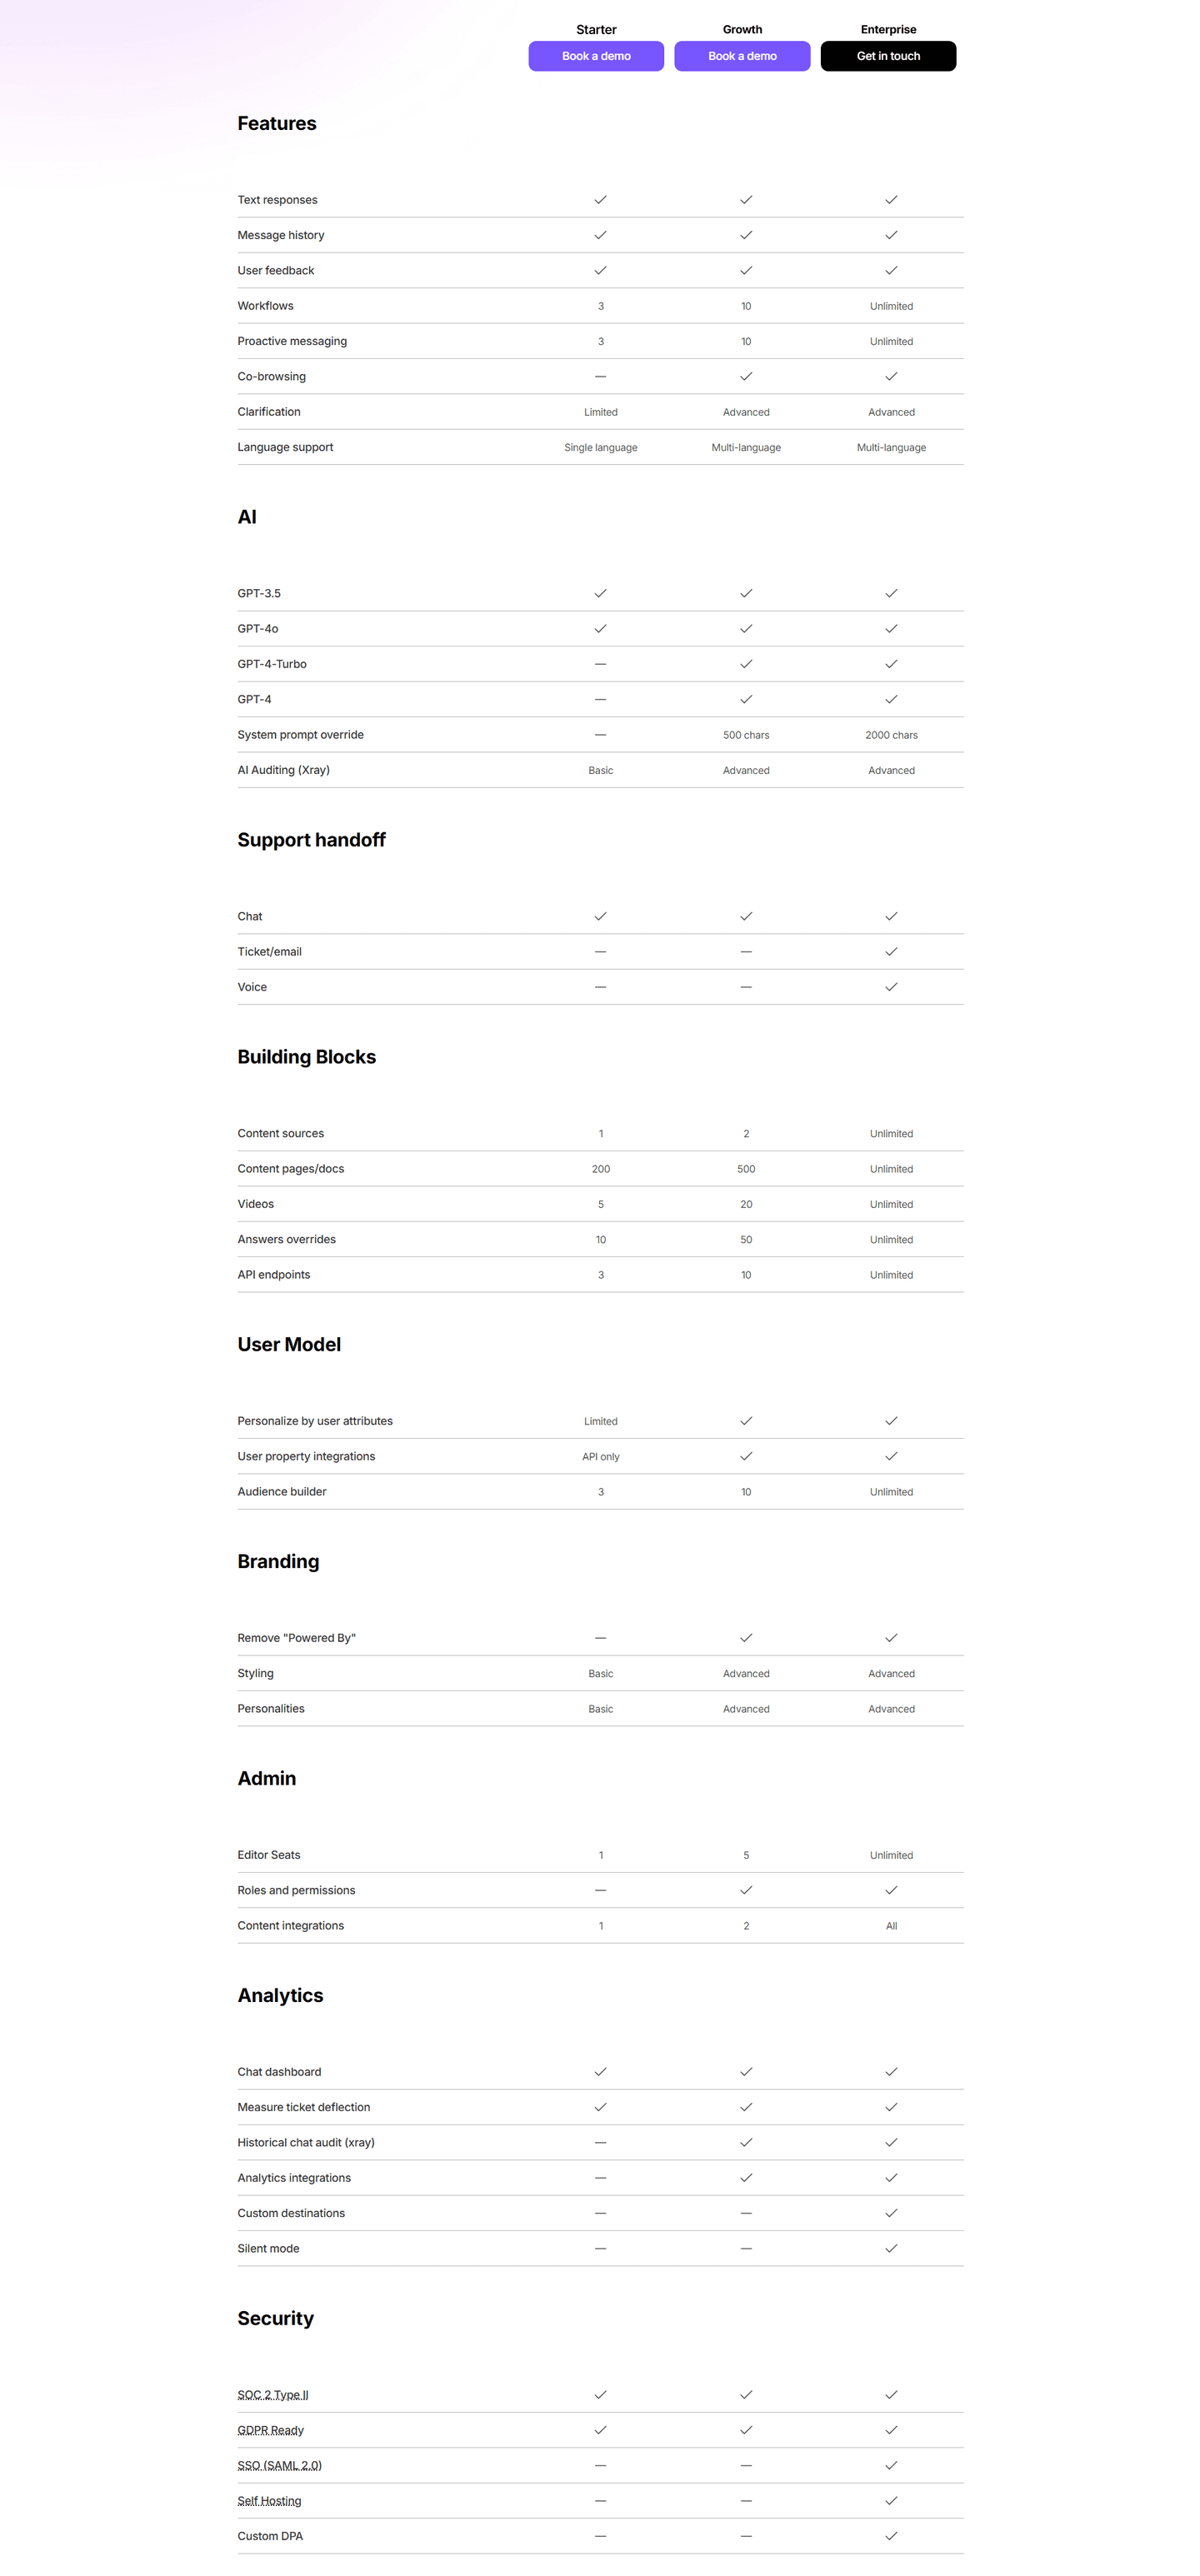
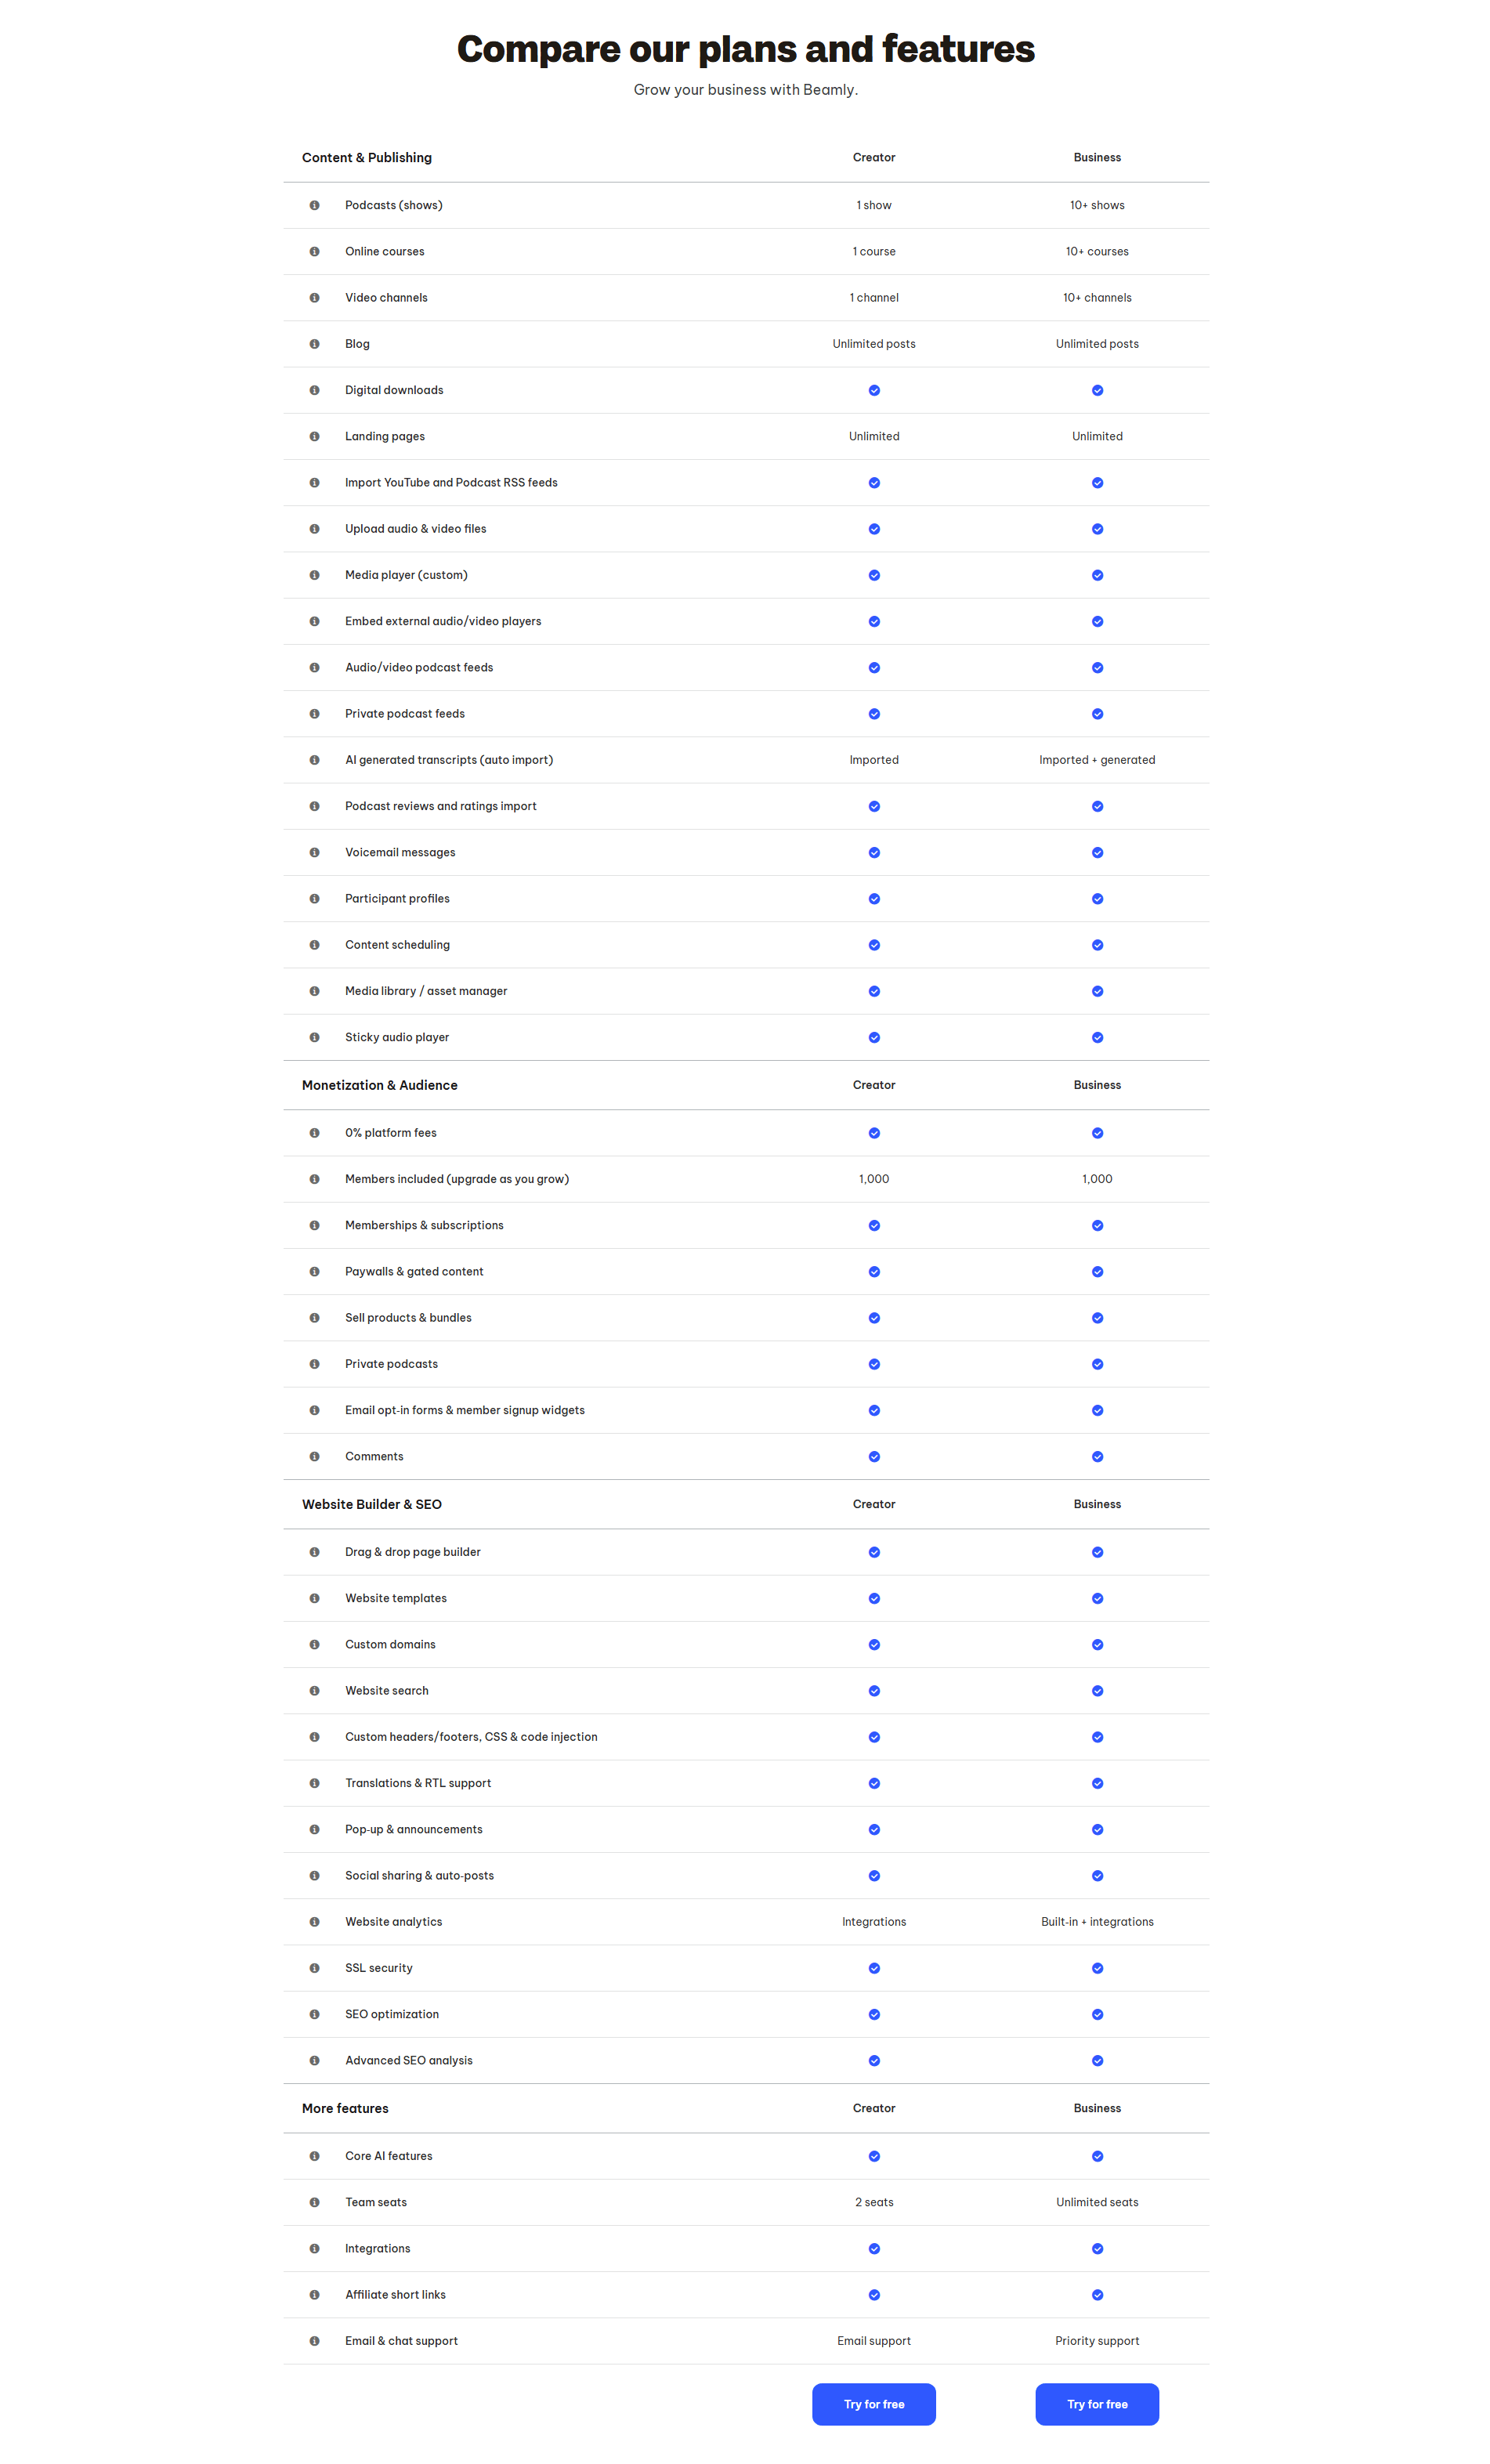
The best examples below use contrast with a point of view. Agorapulse puts a red cross in every cell a plan lacks and tints its Advanced column, so the rows where plans split jump out from the rows they share. Asset Bank spotlights its "Most popular" Professional column and lets check-or-blank cells mark what each tier adds. Qonto mixes checkmarks with hard numbers, like cards included and transfer counts, and tags the Smart plan as popular. CommandBar uses tiered values, Basic versus Advanced and Limited versus Unlimited. Beamly does the same with "1 show" against "10+ shows" and "2 seats" against "Unlimited seats".
The most disciplined tables also say plainly where plans are the same. Lemlist separates its "Included in all plans" baseline from the rows where plans actually differ, so the real differences are easy to find. Once the comparison lands, the button under each column has to catch it, which is why the strongest tables pair this with a clean call to action under every plan and social proof near the price.
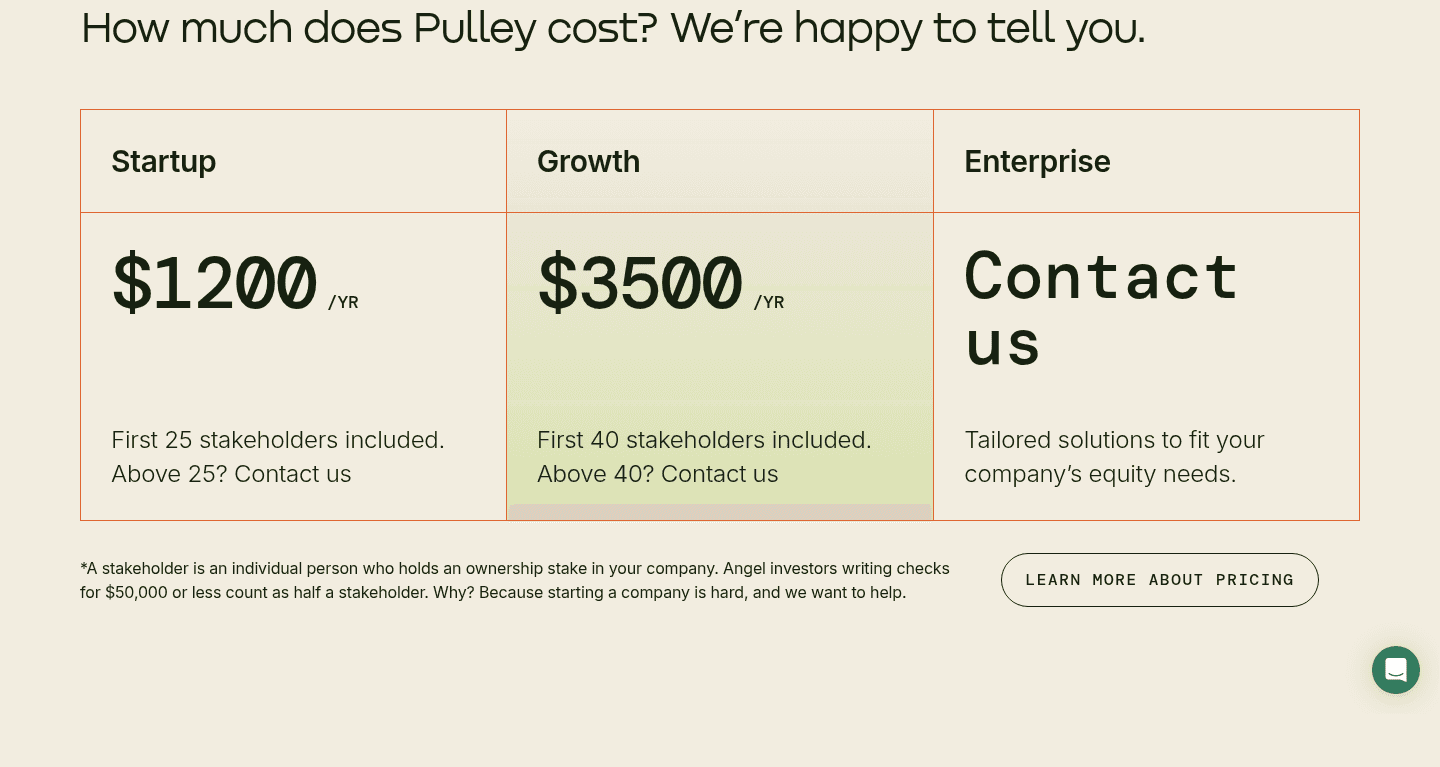
The first failure is a table that shows almost nothing to compare. In the example above, each plan has a price and a stakeholder limit, and the visitor has to click through to learn what else changes. The second is the all-checkmark table, where nearly every row is checked in every column: it looks generous but shows no reason to move up a tier. The third is the vague check, a single mark standing in for "up to 5" versus "unlimited", which hides the exact number the buyer needed to see.

Curated by
Gabriel Amzallag , Founder, Web Anatomy
5 years CRO + SEO at Qonto (2021–2025). After advising 15+ SaaS on their websites (Payfit, Pigment…), the same patterns kept breaking, so I decided to build the source of truth on what works on the web: the intelligence layer every tool, builder, and team uses to ship sites that perform.
The common questions about pricing tables that make plan differences obvious, with answers drawn from 34 scored examples.
Both, depending on the row. A checkmark against a blank cell is enough for a feature you either get or you do not. But for anything measured, a bare checkmark hides the gap: '5,000 profiles' versus 'Unlimited', or '1 show' versus '10+ shows', says what a checkmark cannot. The strongest tables use values on the rows where the number is the whole point.
Give one column a light lift: a tinted or bordered background, a 'Most popular' tag, or a filled button while the others stay outlined. That sets a default the eye lands on, while the other plans stay fully readable for the people they suit.